Gameday AR
Augmenting the in-person gameday experience for soccer fans.
🚨Since graduating, I've refreshed and restyled the UI, but keep scrolling for my process as it stood at graduation!🚨
Go fullscreen here ↓
Fullscreen here ↓
But how did I get there? Here's my research:
Evaluating the sports app landscape
What do existing sports apps offer?
I began by taking stock of what sports stats apps already on the market generally look and feel like, and what sorts of statistics they tend to include.
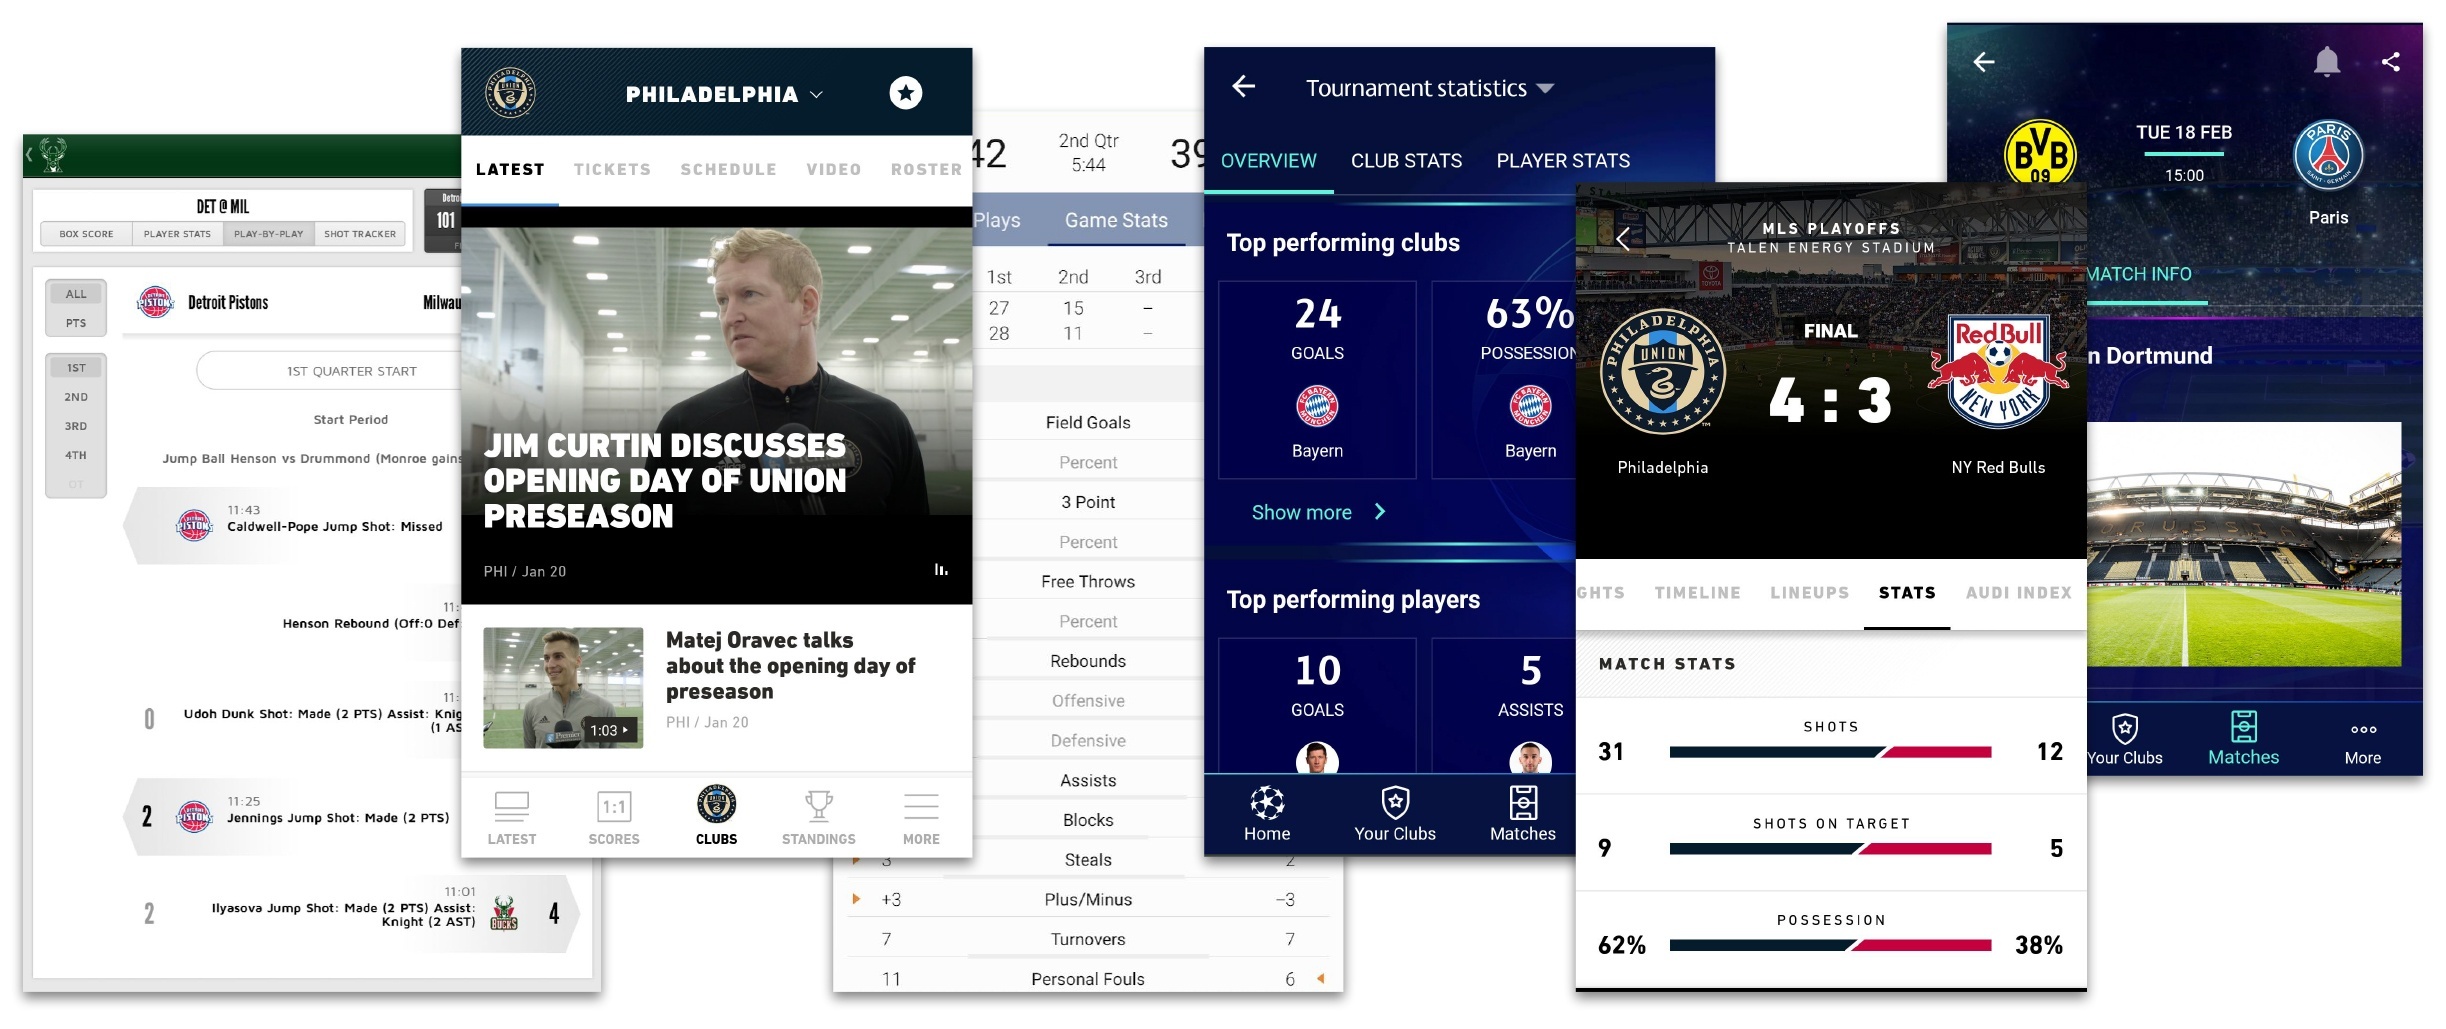
A competitive audit of NBA apps, the MLS league app, the Champions League app and more
What do existing apps focus on?
I qualitatively analyzed what sorts of features and statistics the apps focus on to understand where there might be opportunity areas. Most apps focus on news, scores and standings, and aren't targeted at helping new fans who are watching the game.
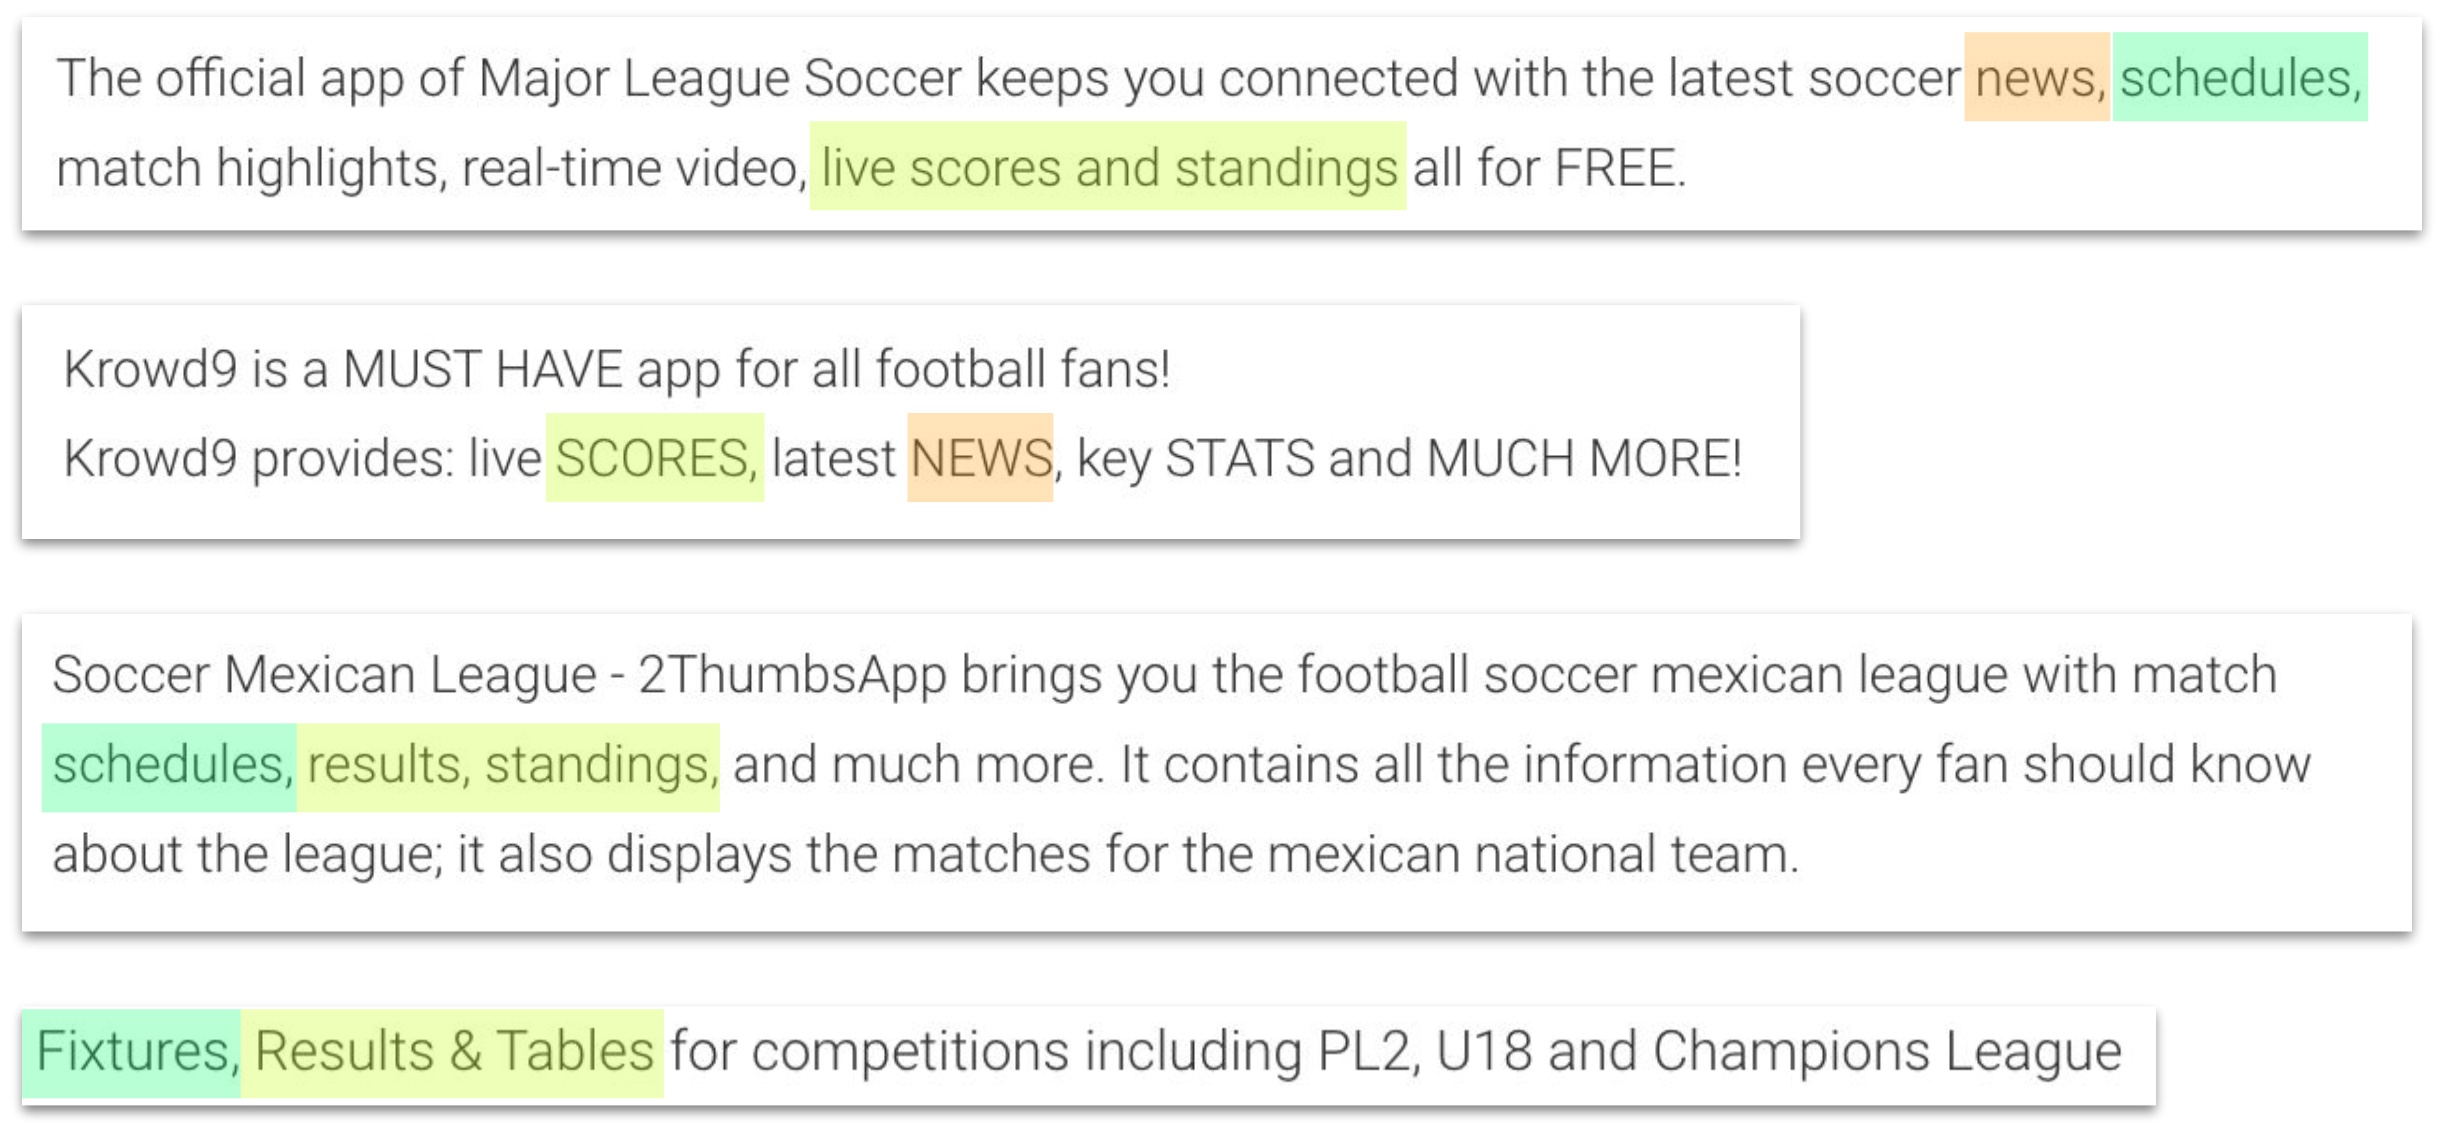
Features and focuses stay very similar, even across sports.
How do fans experience game-day?
Interviewing fans with differing relationships to the game
To help find opportunity areas, I interviewed people on different parts of these quadrants based on the axis of "Soccer Knowledge" and "Gameday Experience." This means non-fans who don't go to games, people who don't have a lot of soccer experience but go to games, people who have experience and go to games, and people who are soccer experts and go to games.
Based on these interviews and the wealth of stat-finding apps, I decided to focus on creating an augment for live games. I also found that while super-fans who go to many games and have high soccer experience crave more and more niche information, casual fans and irregular attendees had more pressing and more manageable requests:
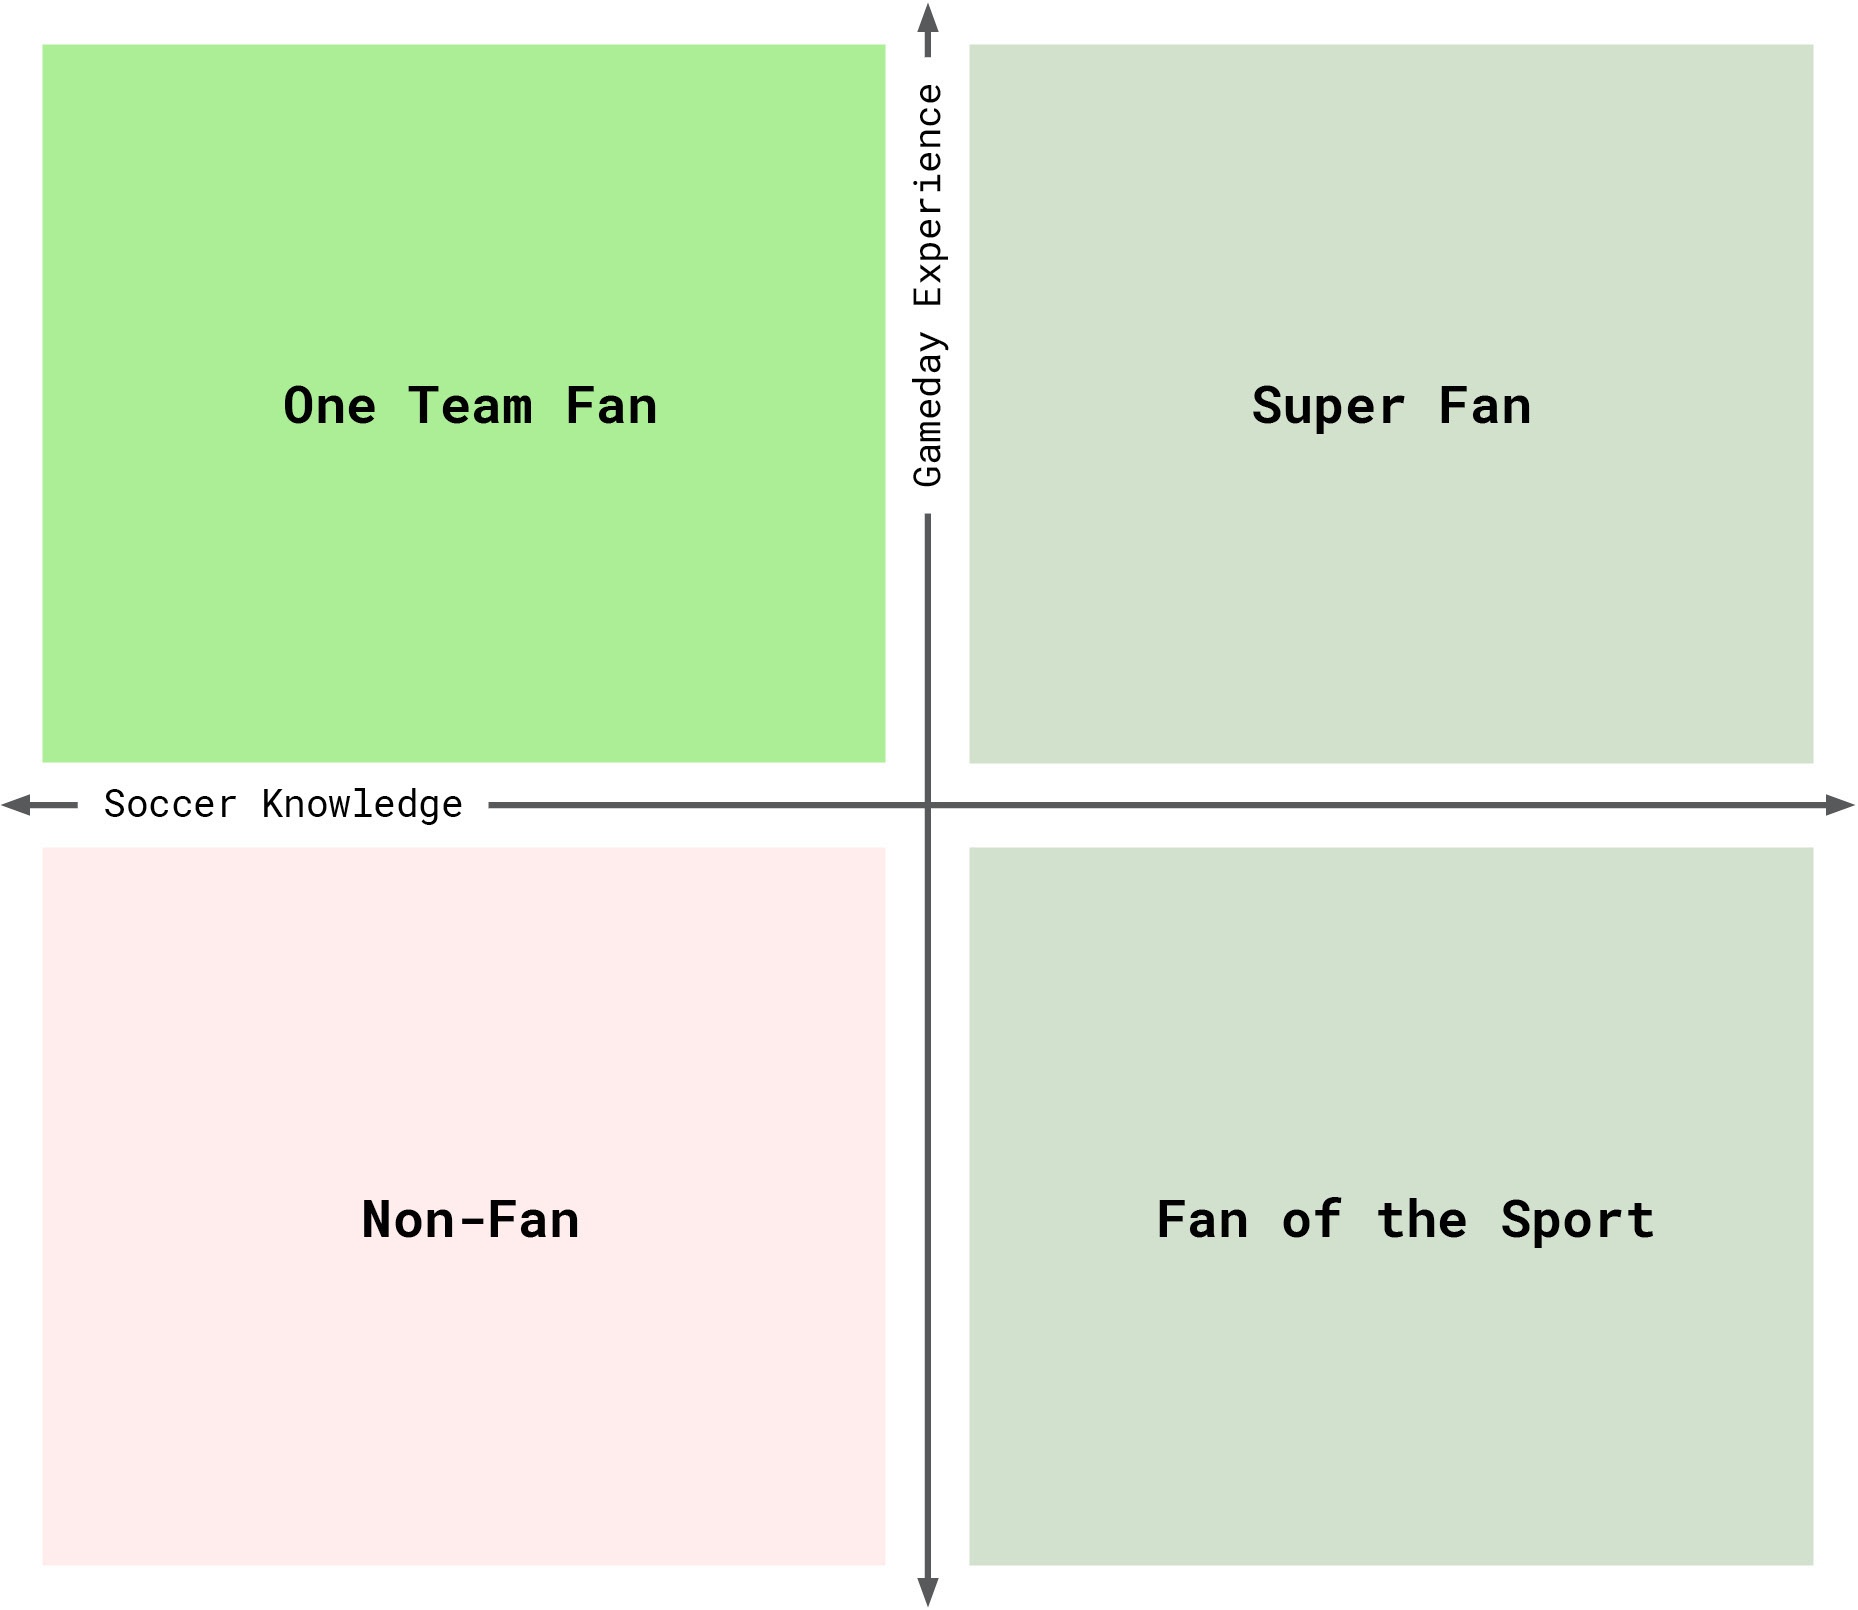
"I know the game but I don't know about the team."
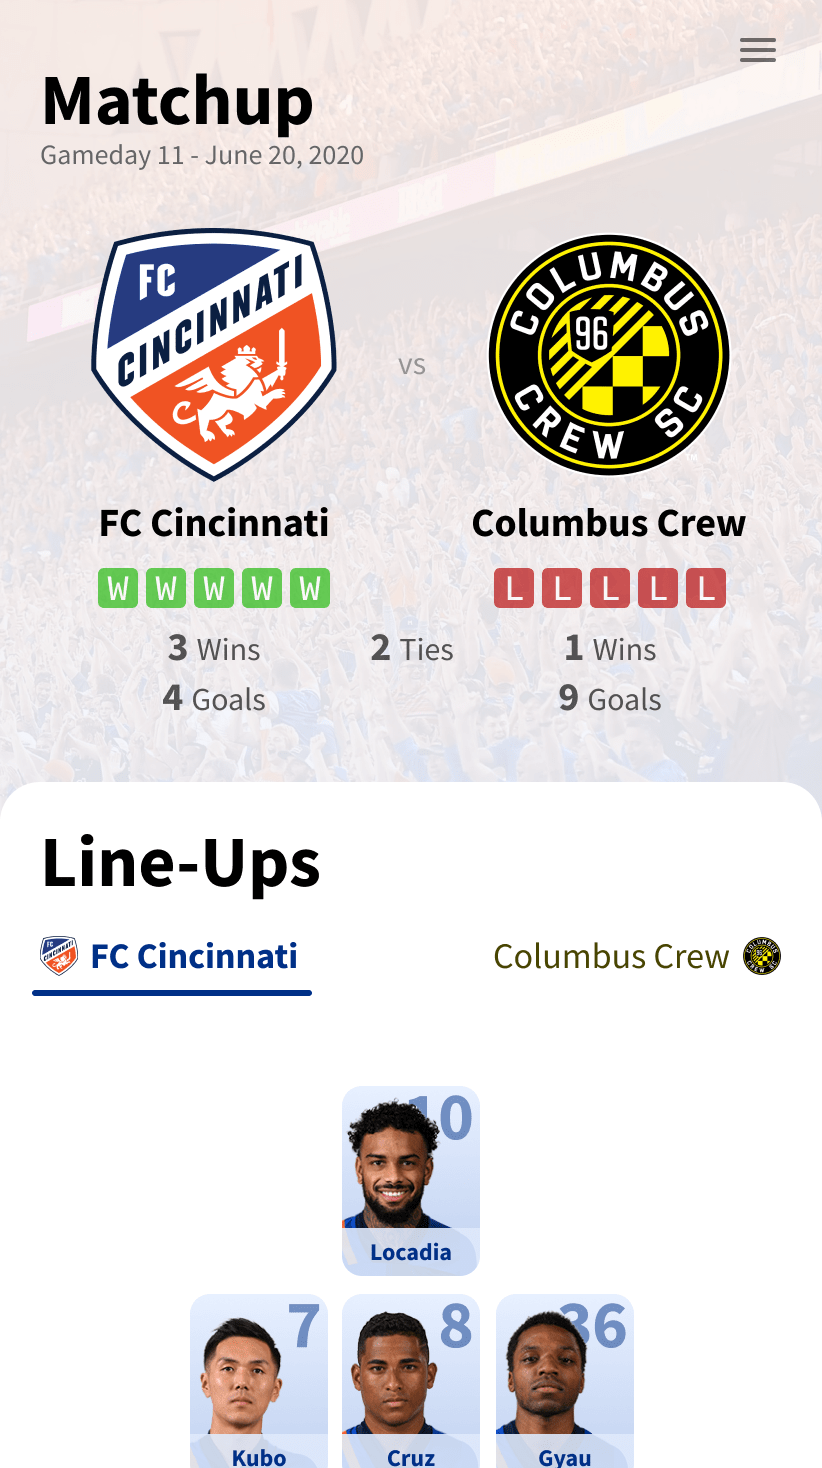
The Pitch
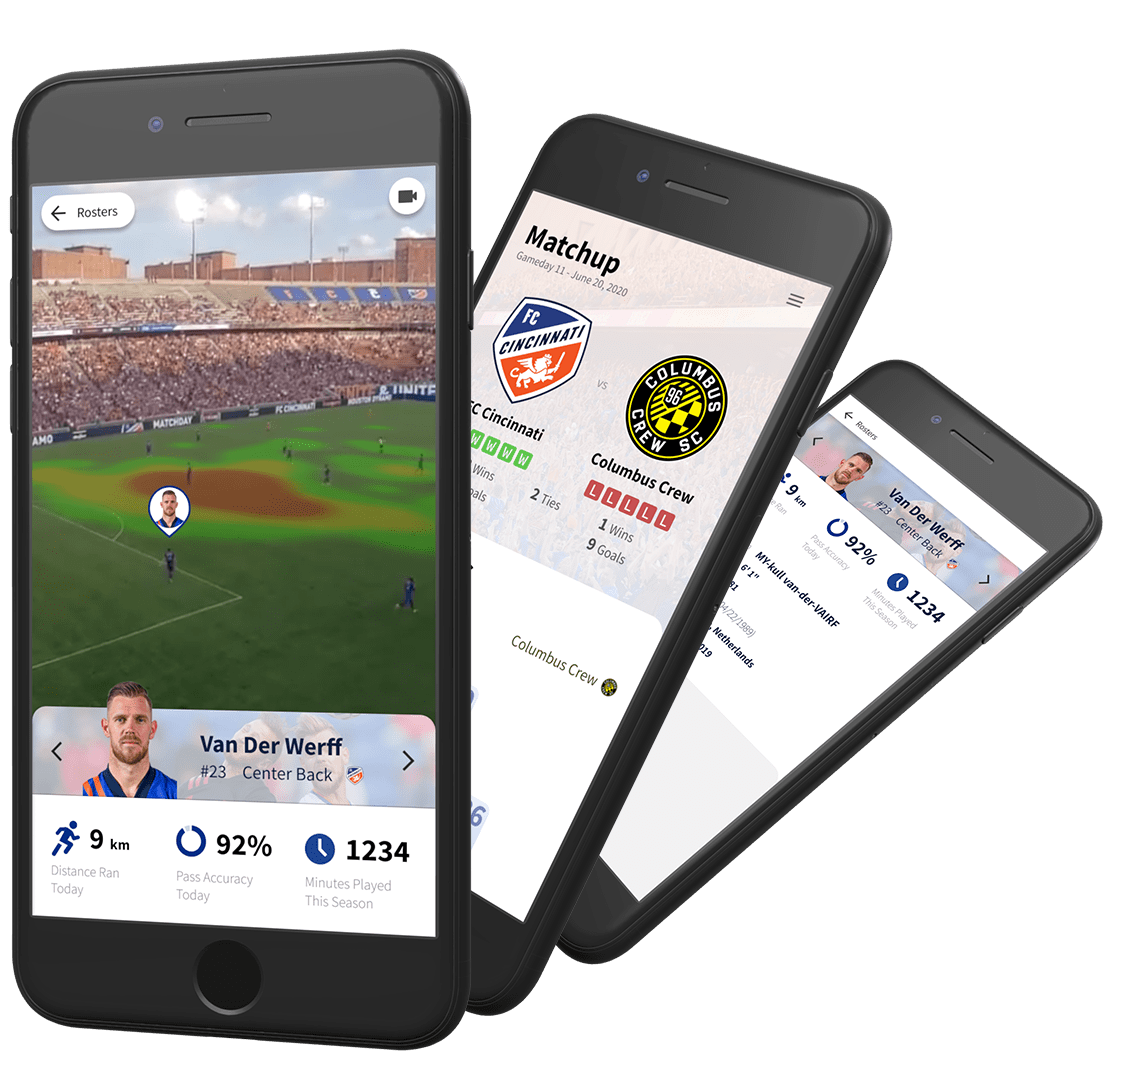
I proposed an Augmented Reality app for use at and during live soccer games to help fans connect with the players on the field, and surface common statistics in a novel way.
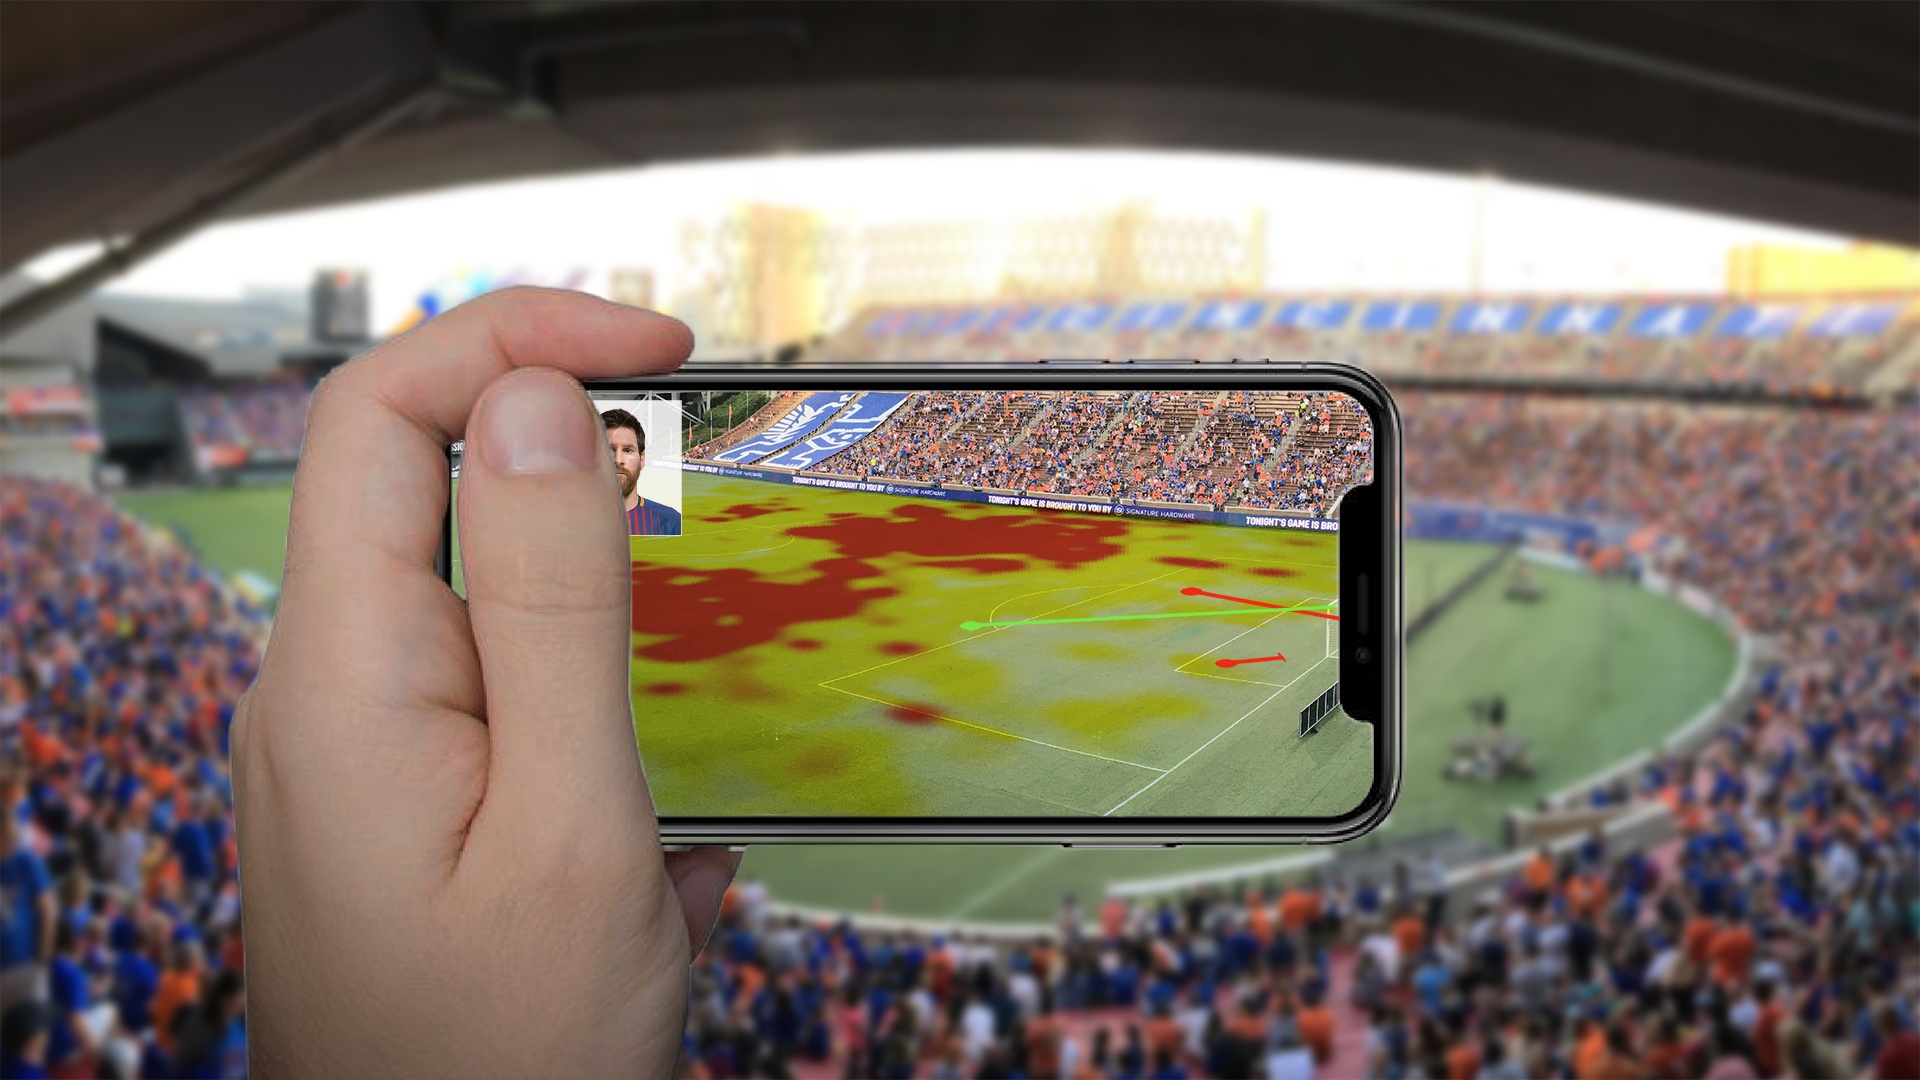
The very first mockup communicating my vision for the app
Exploring Visualization Possibilities
To start on the app I began creating visualizations of soccer stats to get to grips with how these statistics are traditionally displayed, and how I might display them in my AR experience. I focused on data points that were commonly mentioned in interviews and surveys.
First, discover what fans find important
Surveying Fans on what they find important
I asked soccer fans what sorts of information they're wondering about or taking note of while they watch games. By also asking about experience with playing soccer and how often they attend games, I could learn what information my different demographics would find most useful in the app.
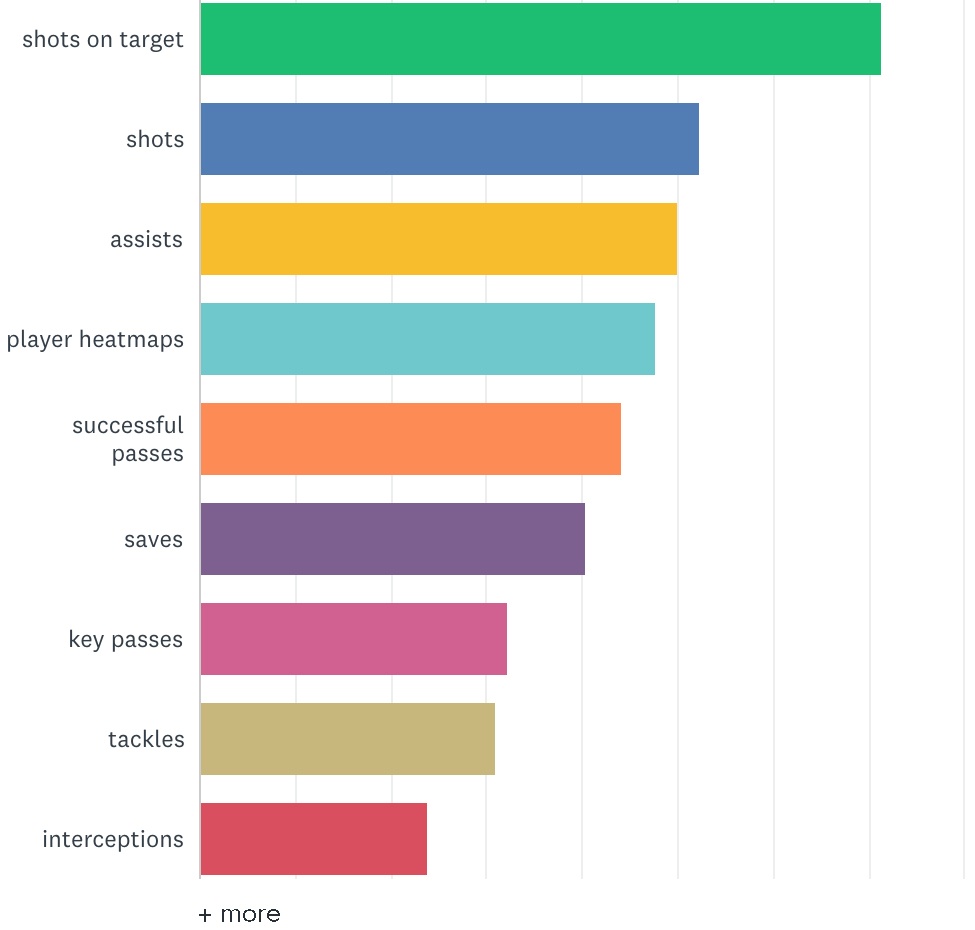
Chart generated in Survey Monkey
Foundations in 2D
First I made basic 2D visualizations of commonly cited statistics in order to get a feel for established visualizations and the statistics I would be dealing with.
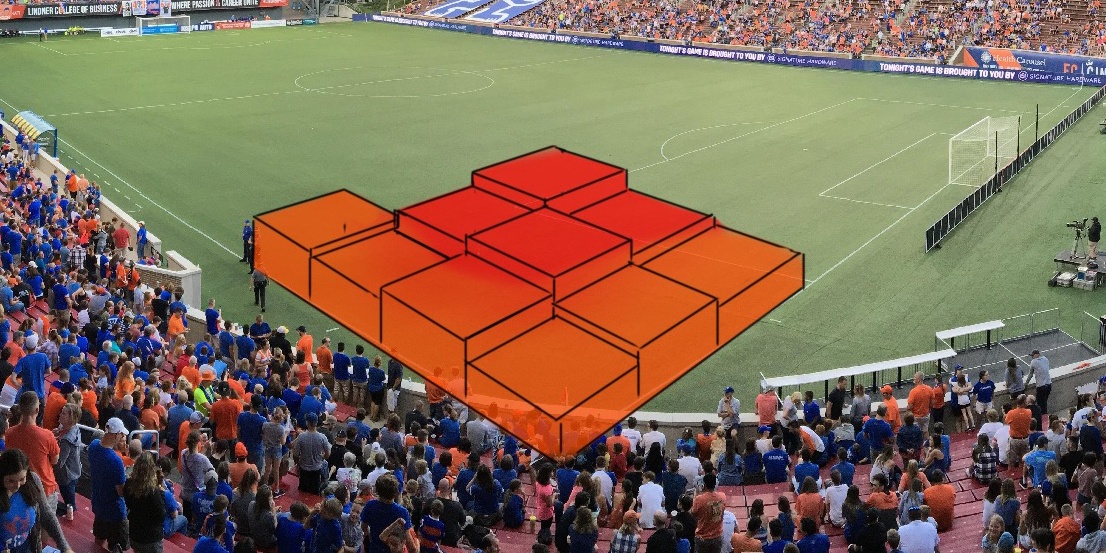
Moving to 3D
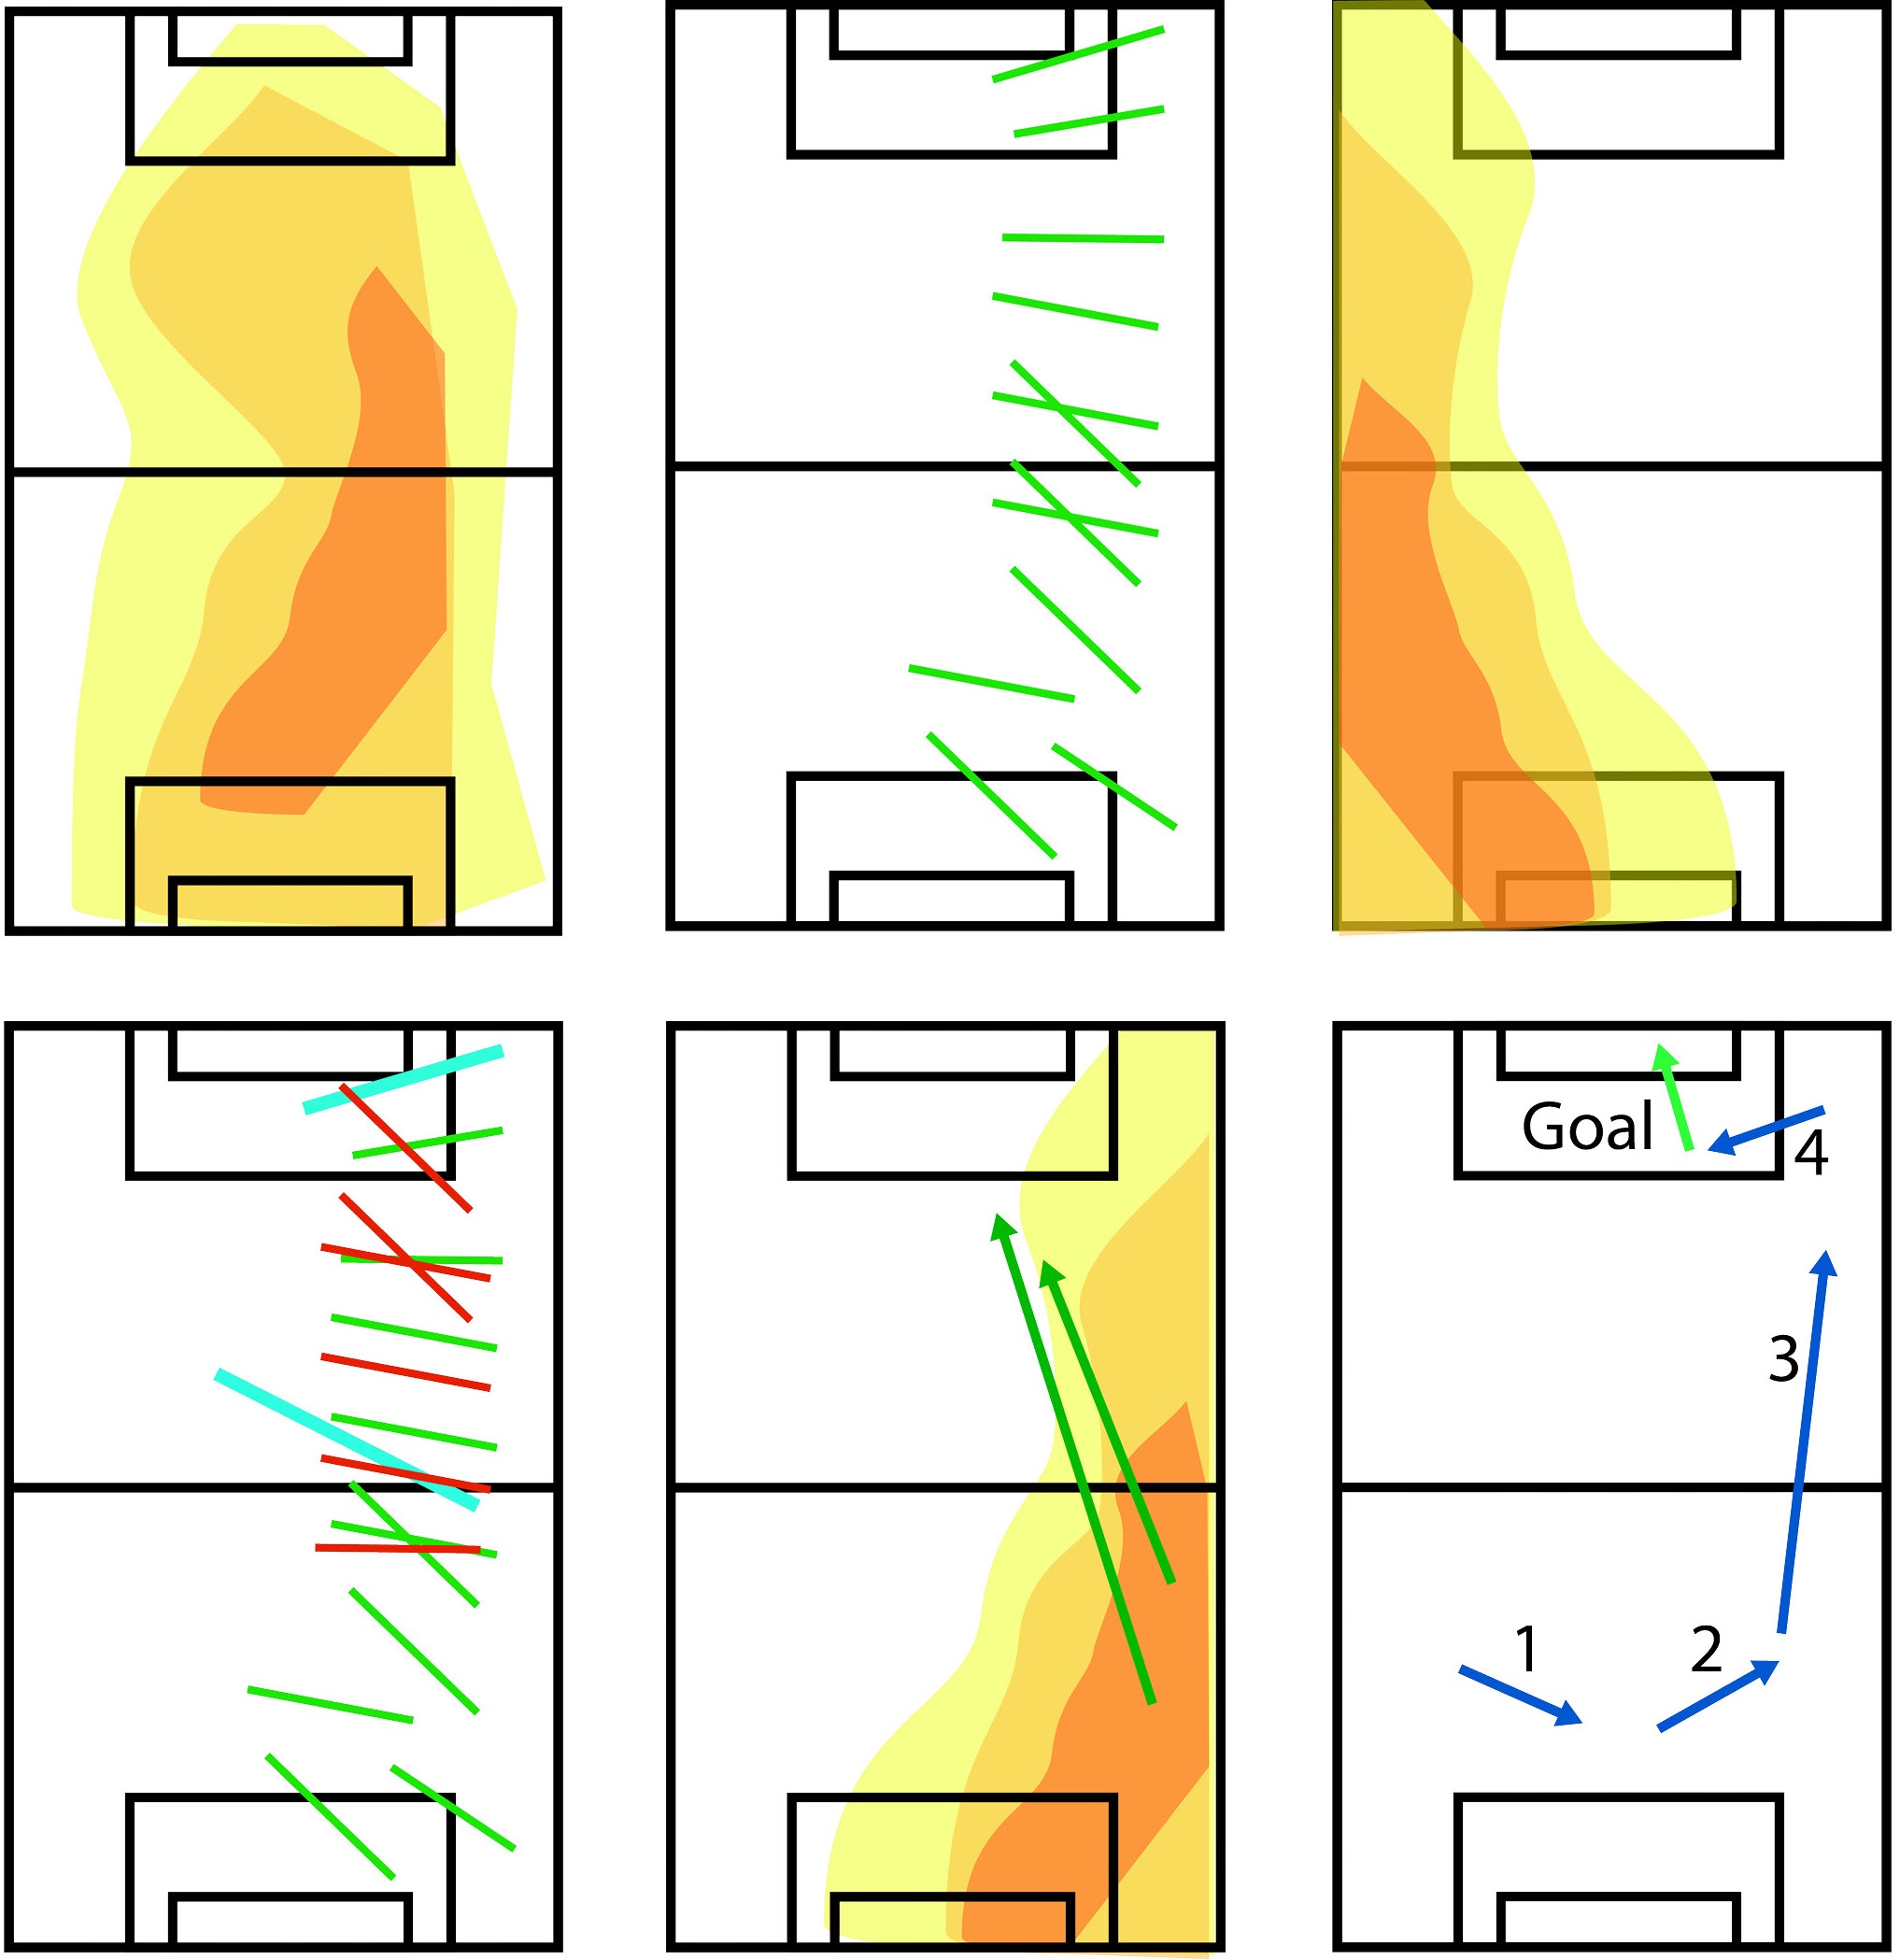
Next I explored how those visualizations could be translated into a 3D space suitable for an Augmented Reality experience.
Passing Chart
Shot Chart
Passing Chart Variant
"There's a lot going on in a small area...The 3d part doesn't add any value to me"
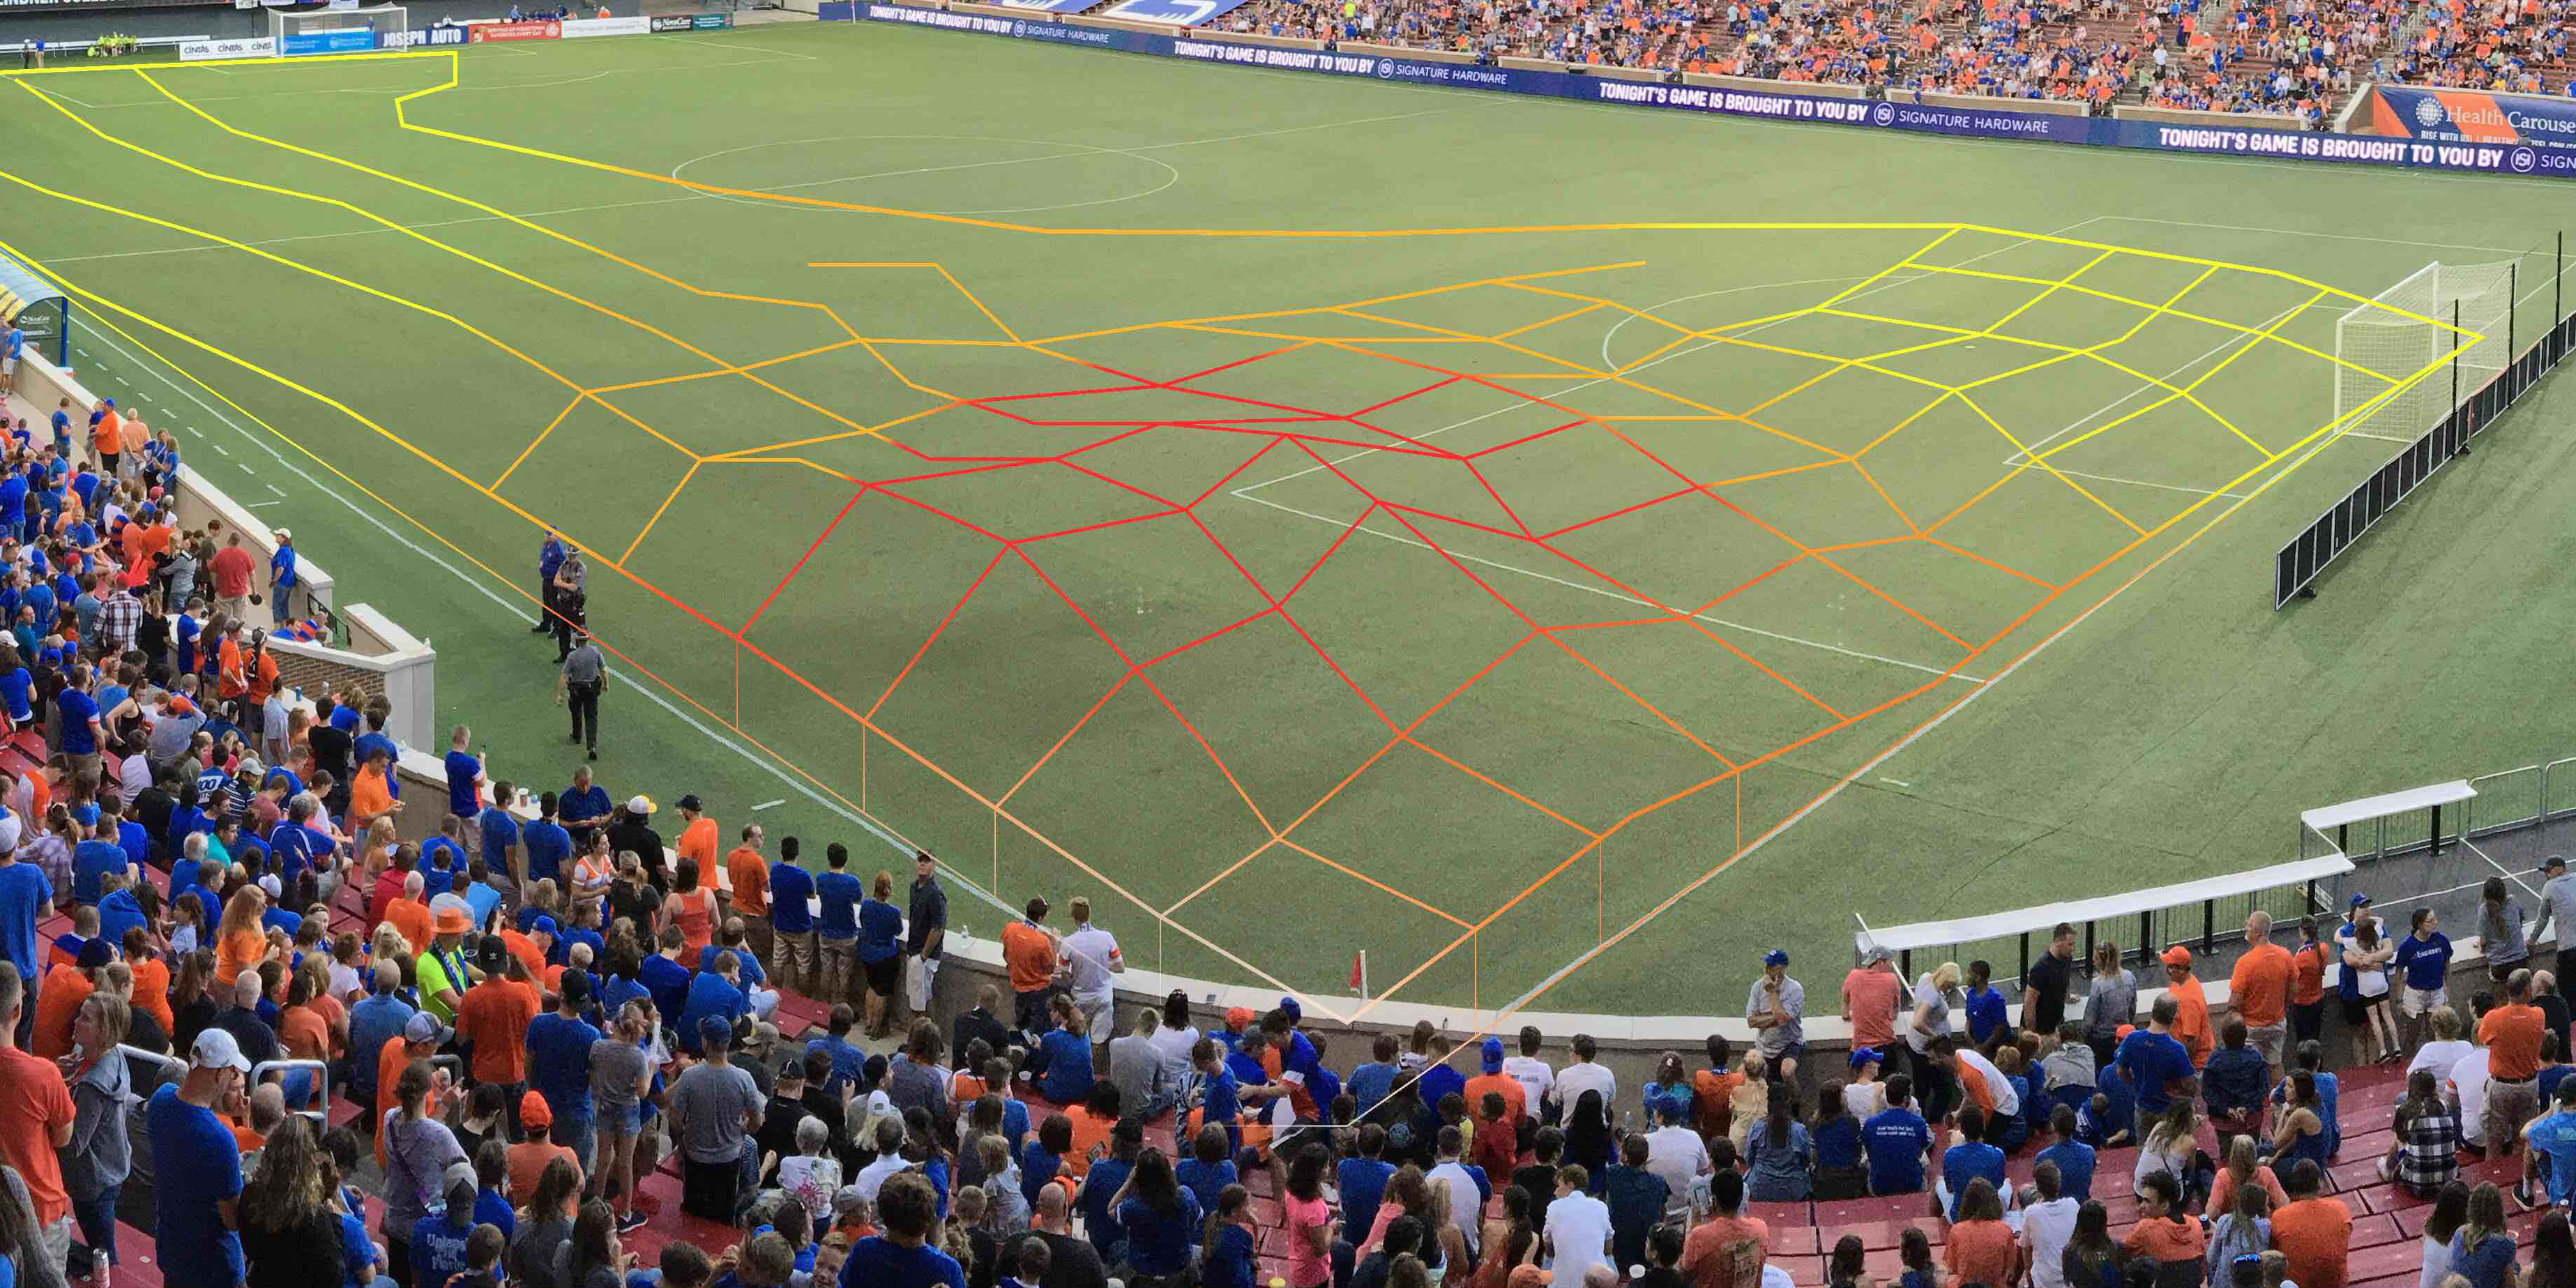
Focusing on Augmented Reality's strengths
Big Picture and Non-Detailed
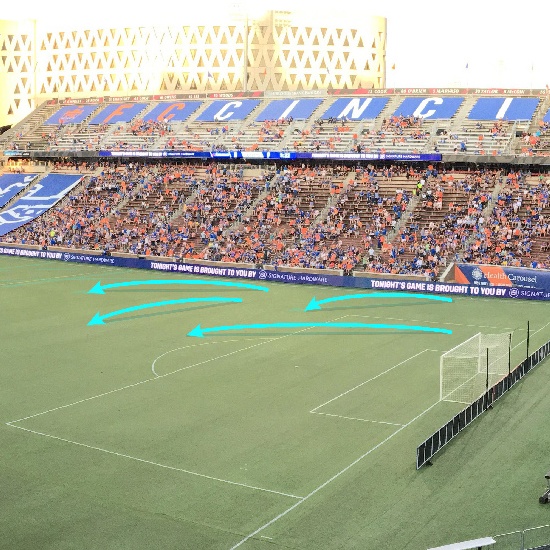
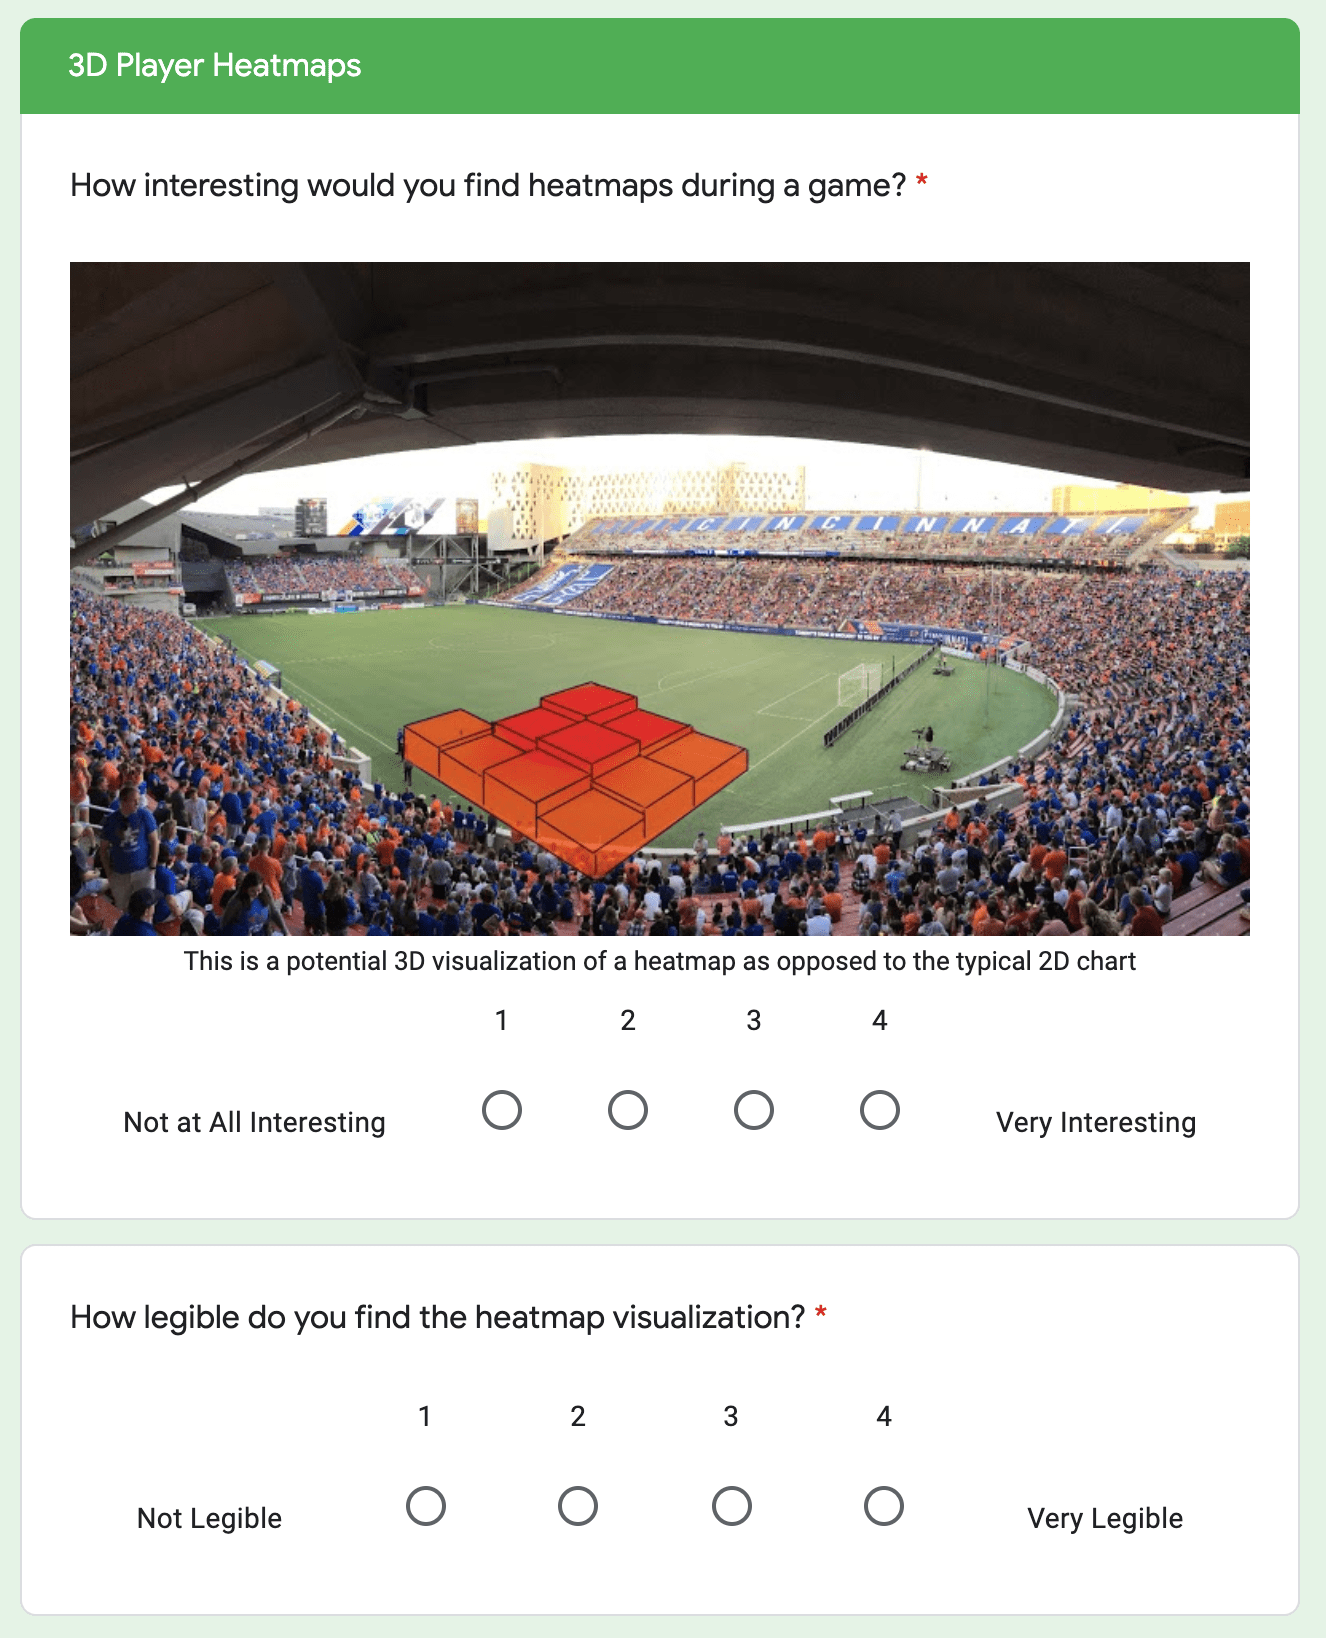
Since it's difficult to show such positionally dependent statistics like shot placement in an AR app, I decided to focus on less finely detailed statistics. Player heatmaps were highly requested and fit those criteria, so I explored that avenue.
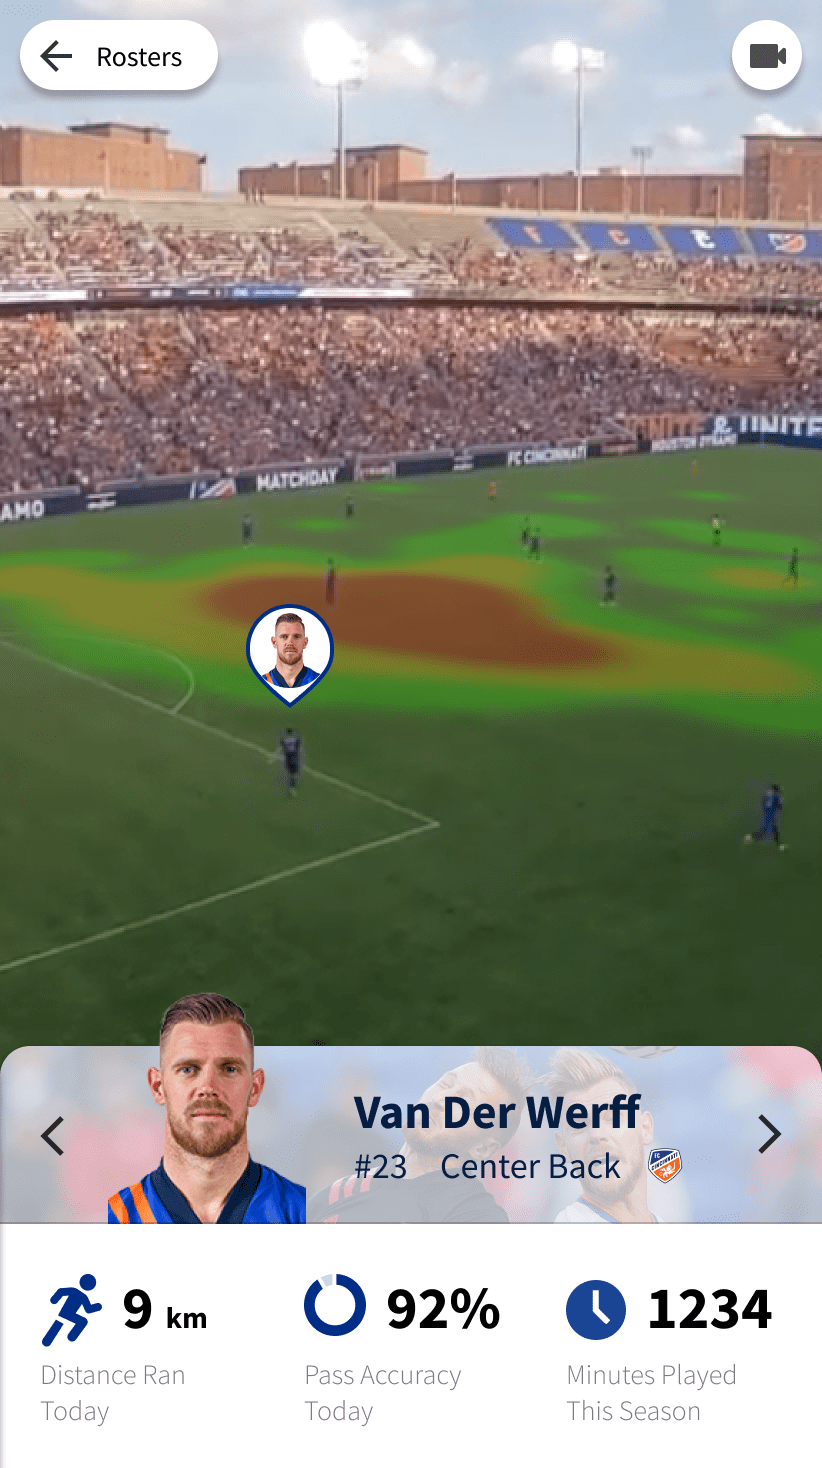
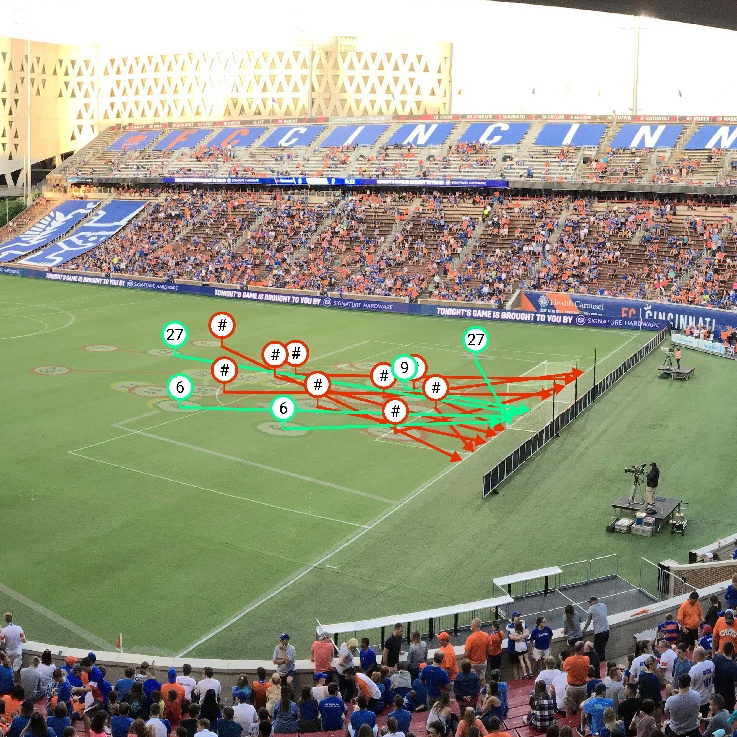
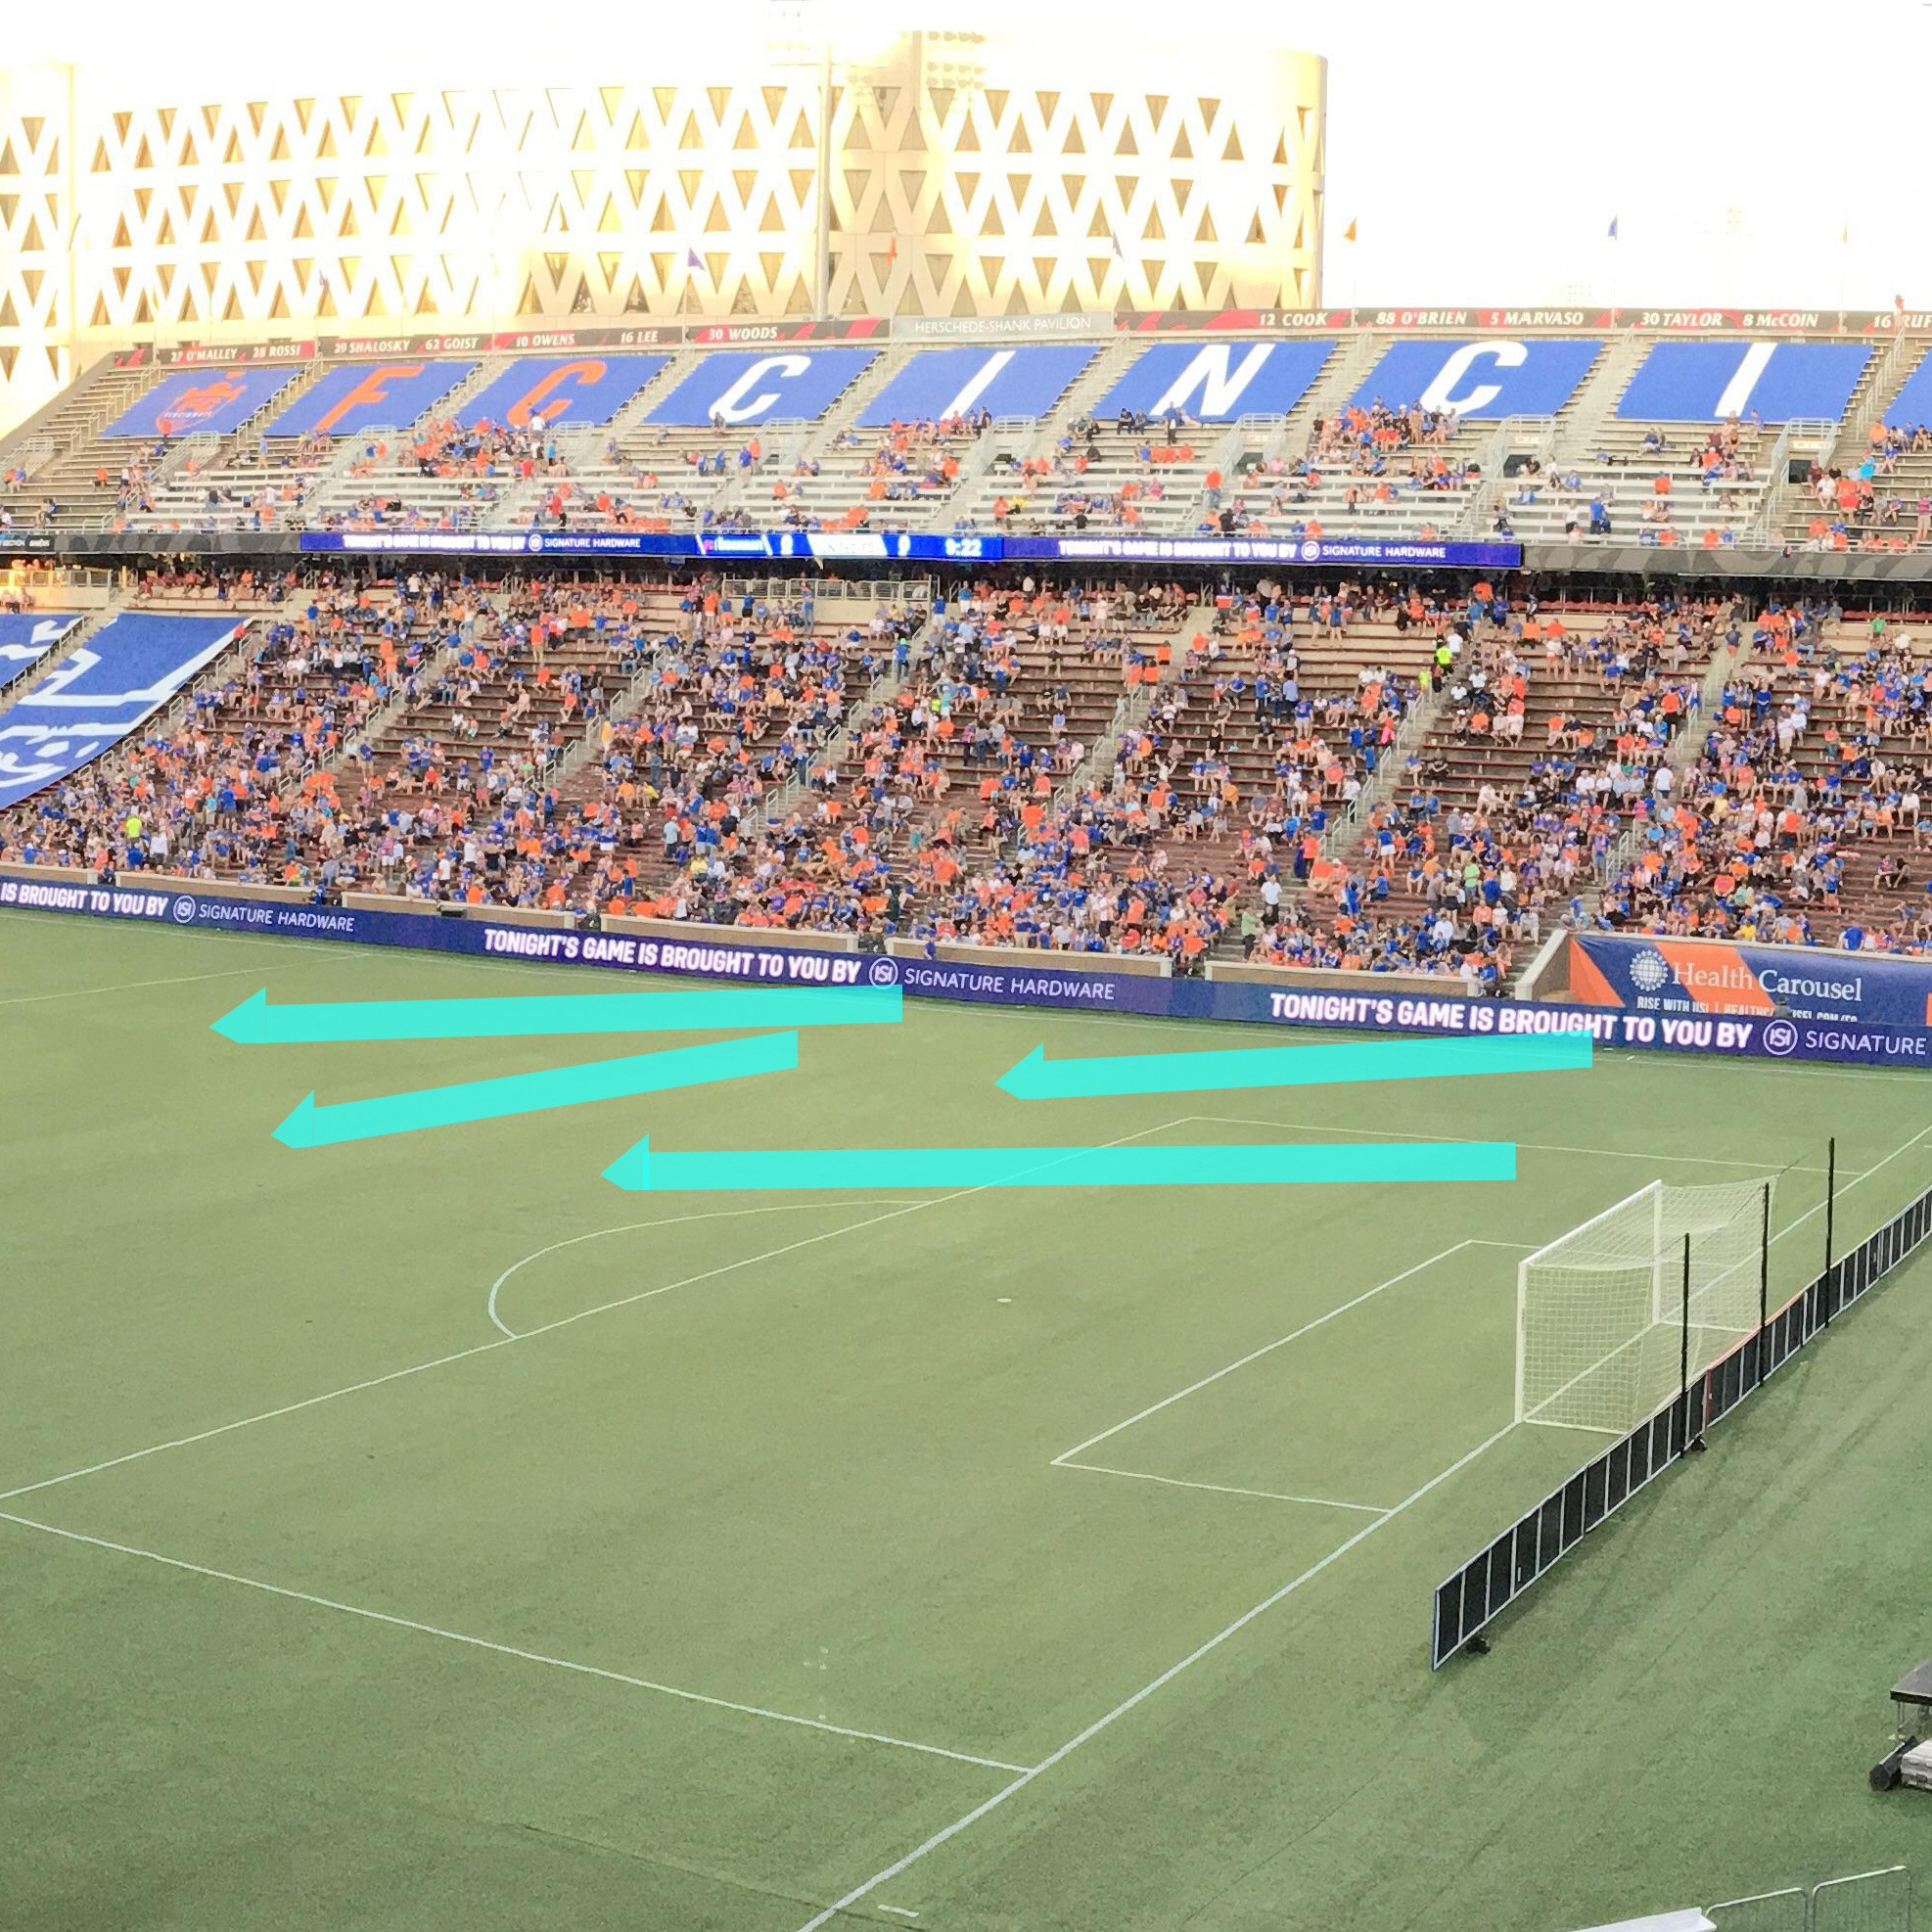
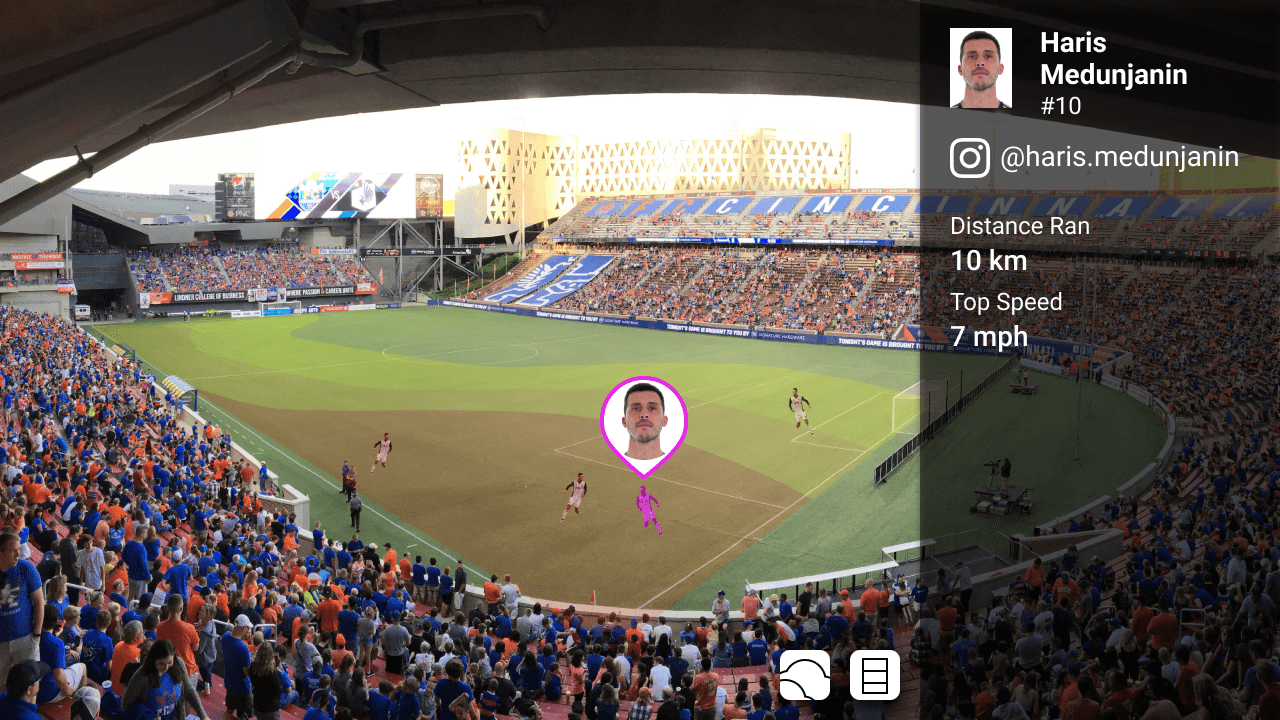
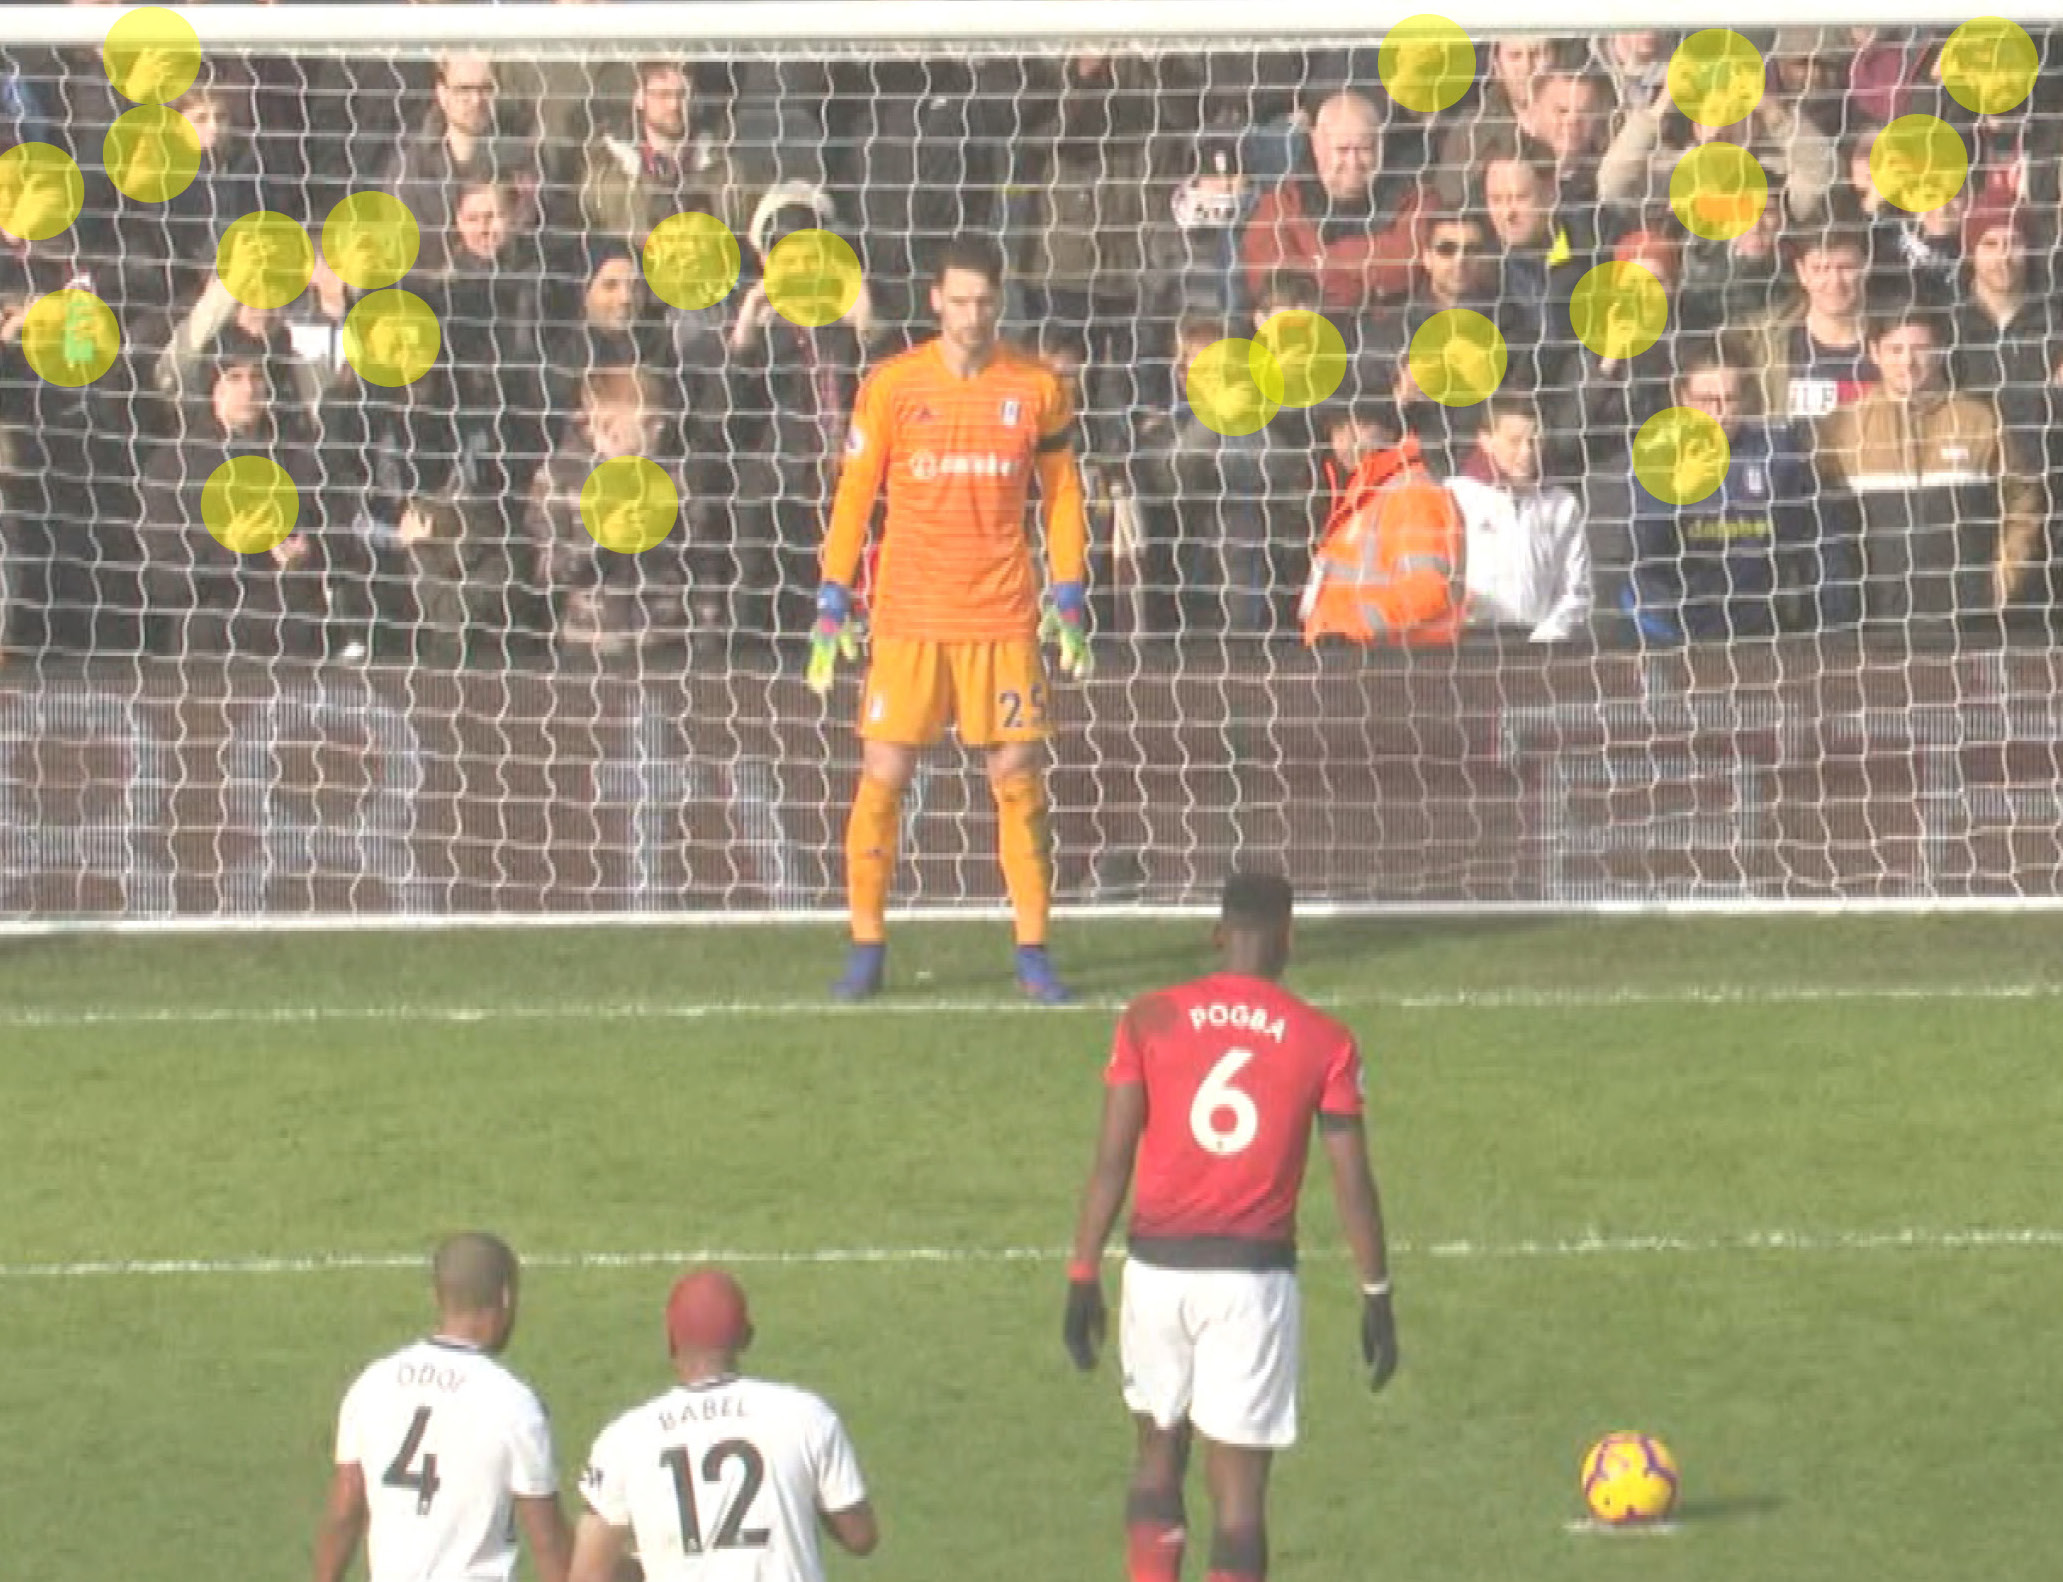
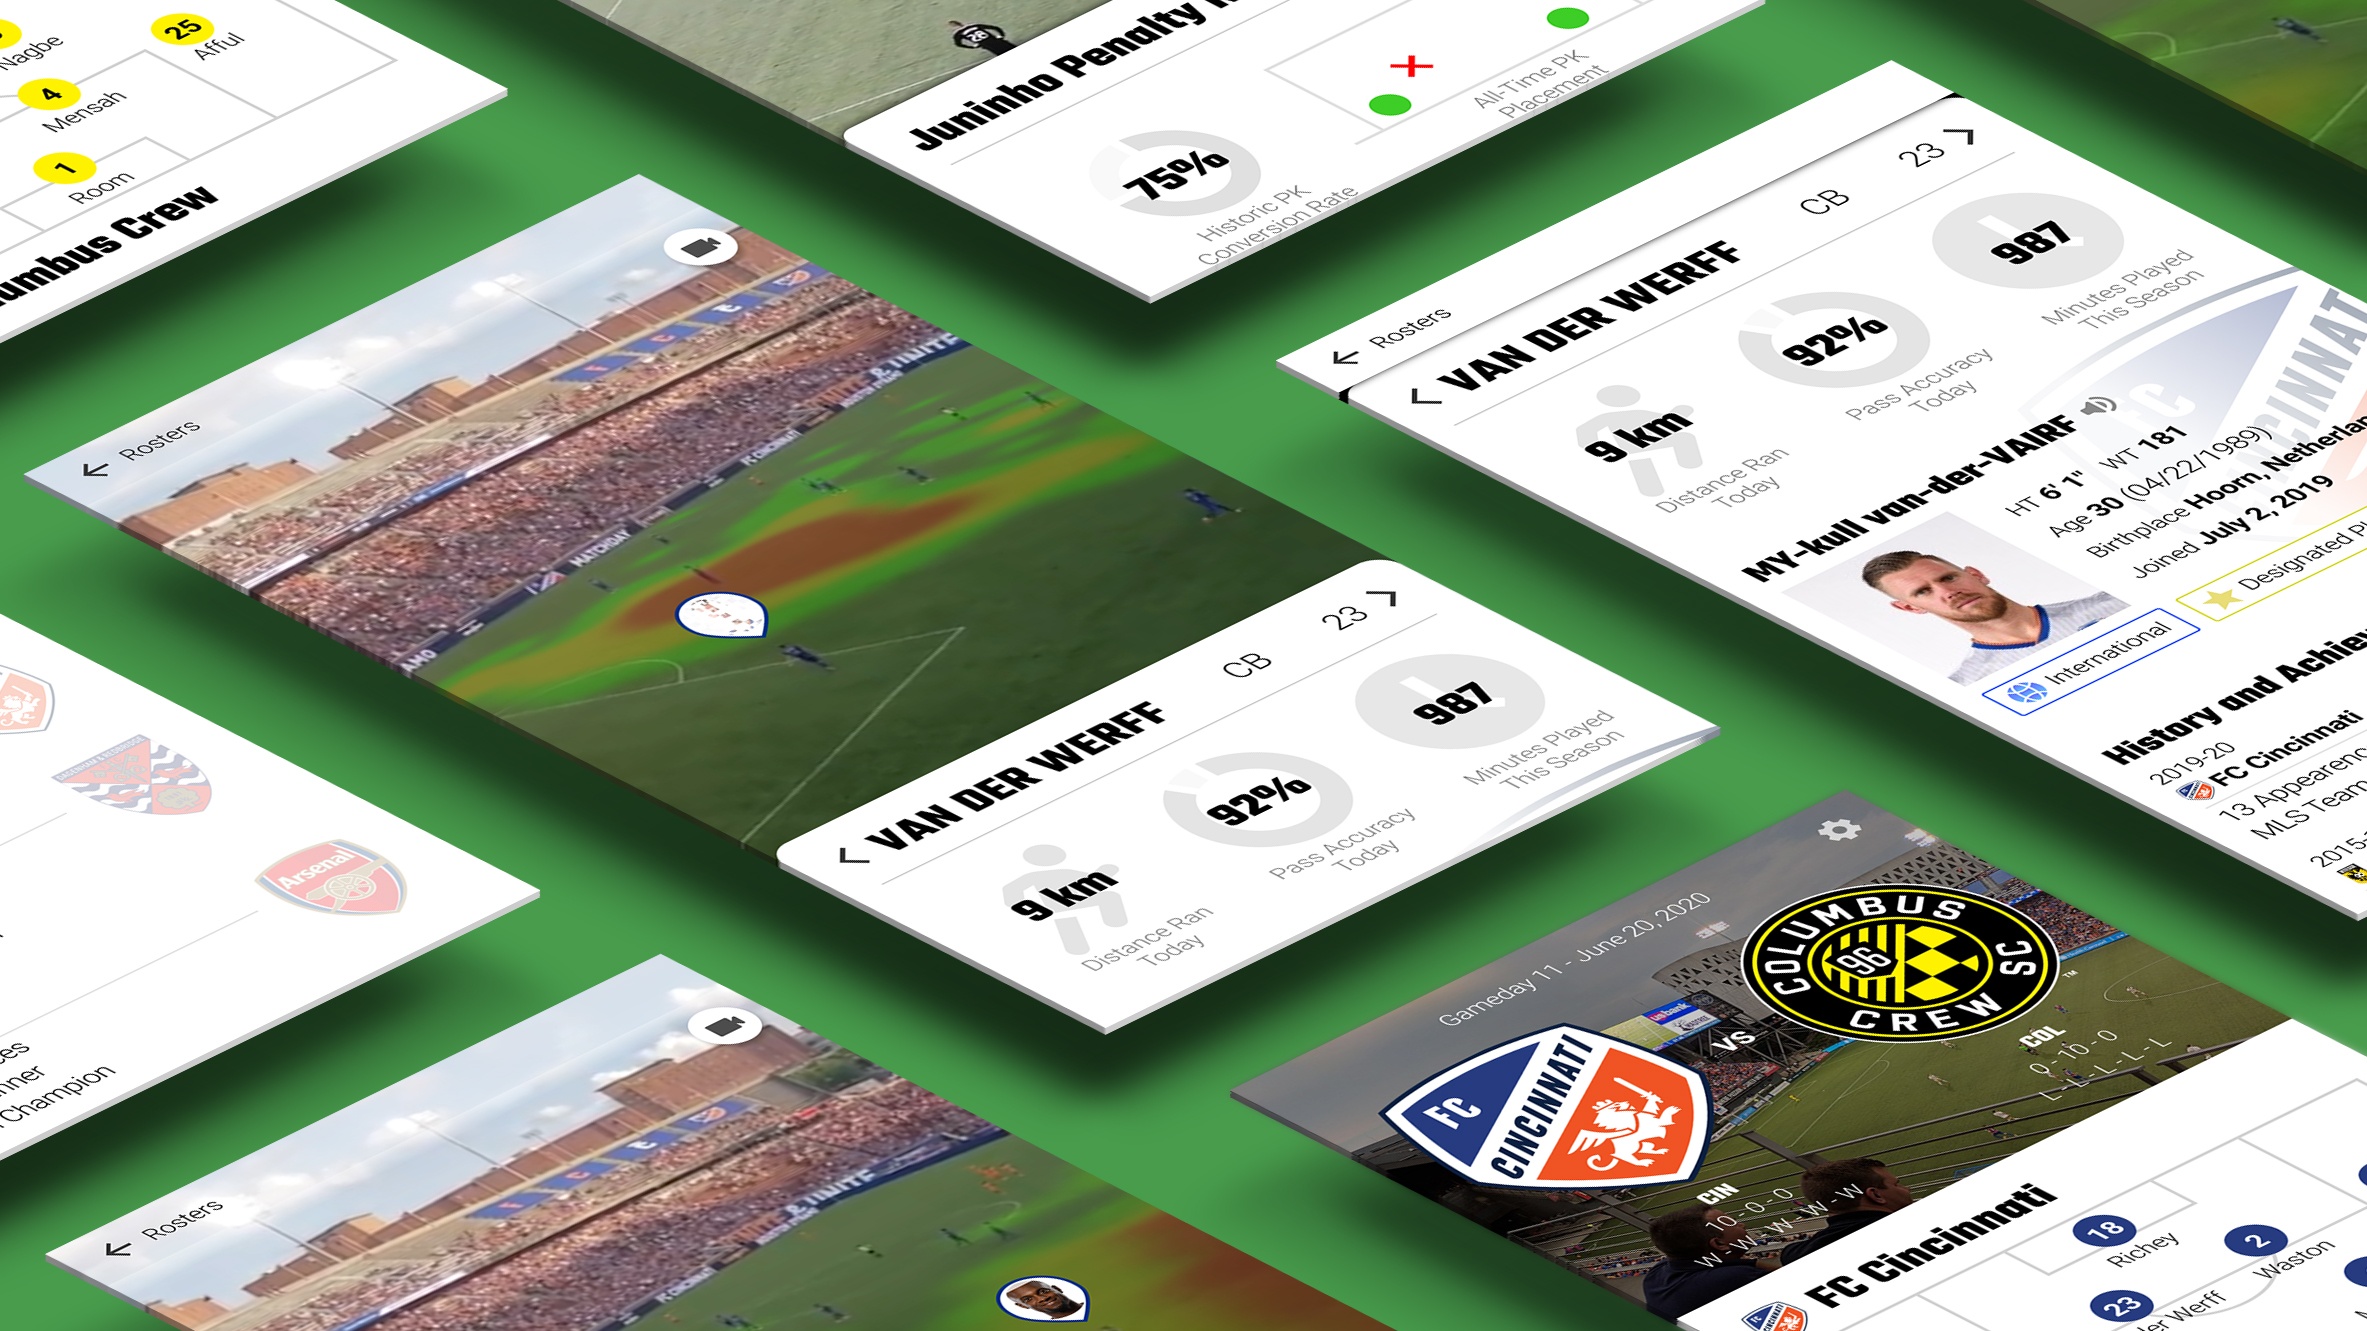
Highlighting and Explaining Reality
Again, since detail is difficult to convey over such a large area in AR, I decided to explore how AR could help highlight players individually. This could help fans learn about players they aren't familiar with.
Validating Technology and User Testing
Next I garnered feedback on the explorations I had created and looked into what data points are already being tracked and the technological capabilities of AR to make sure my proposals are feasible.
Vetting The Technology
Although the project is speculative, I wanted to make sure it was grounded in reality and actually feasible. Therefore, I investigated the technology behind tracking soccer players and AR functionality. I then created a comprehensive audit of every statistic that is tracked and AR capabilities to reference moving forward.
This meant first experimenting with existing AR apps and experimenting with AR app creation software such as Zapworks, Torch and Spark AR. I also looked into the stats that are tracked during soccer games already, and specifically the technical specs of the trackers that players wear. Lastly I brought all of these data points into a comprehensive document to remind myself of what is possible while designing prototypes.
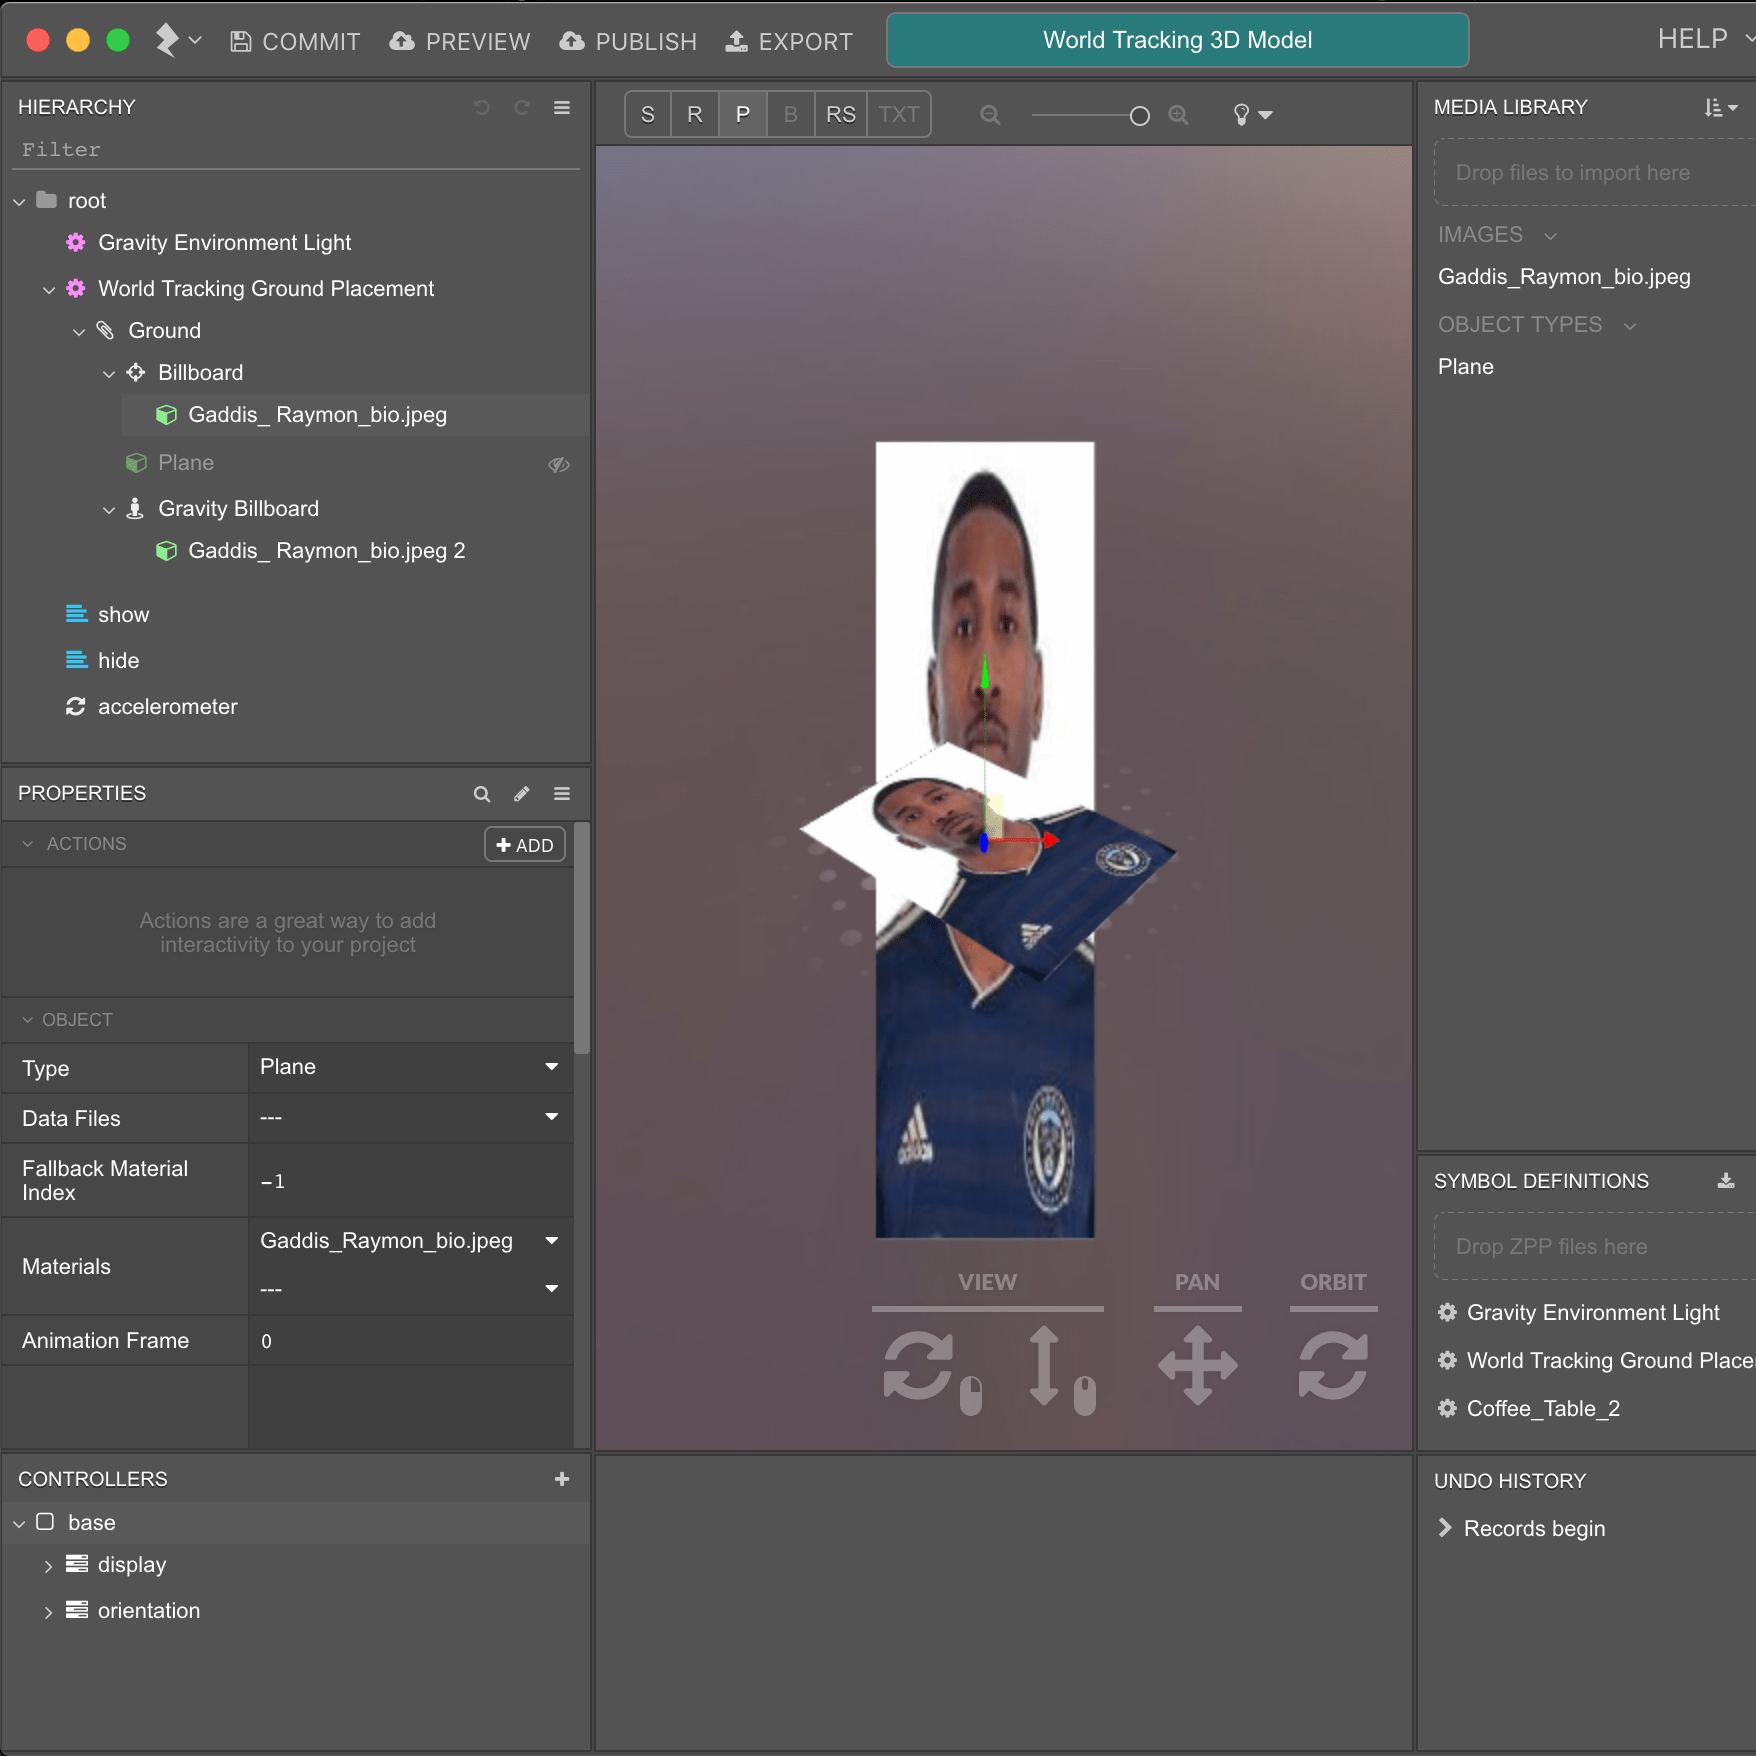
Experimenting with Zapworks
STATSports' product functionality details
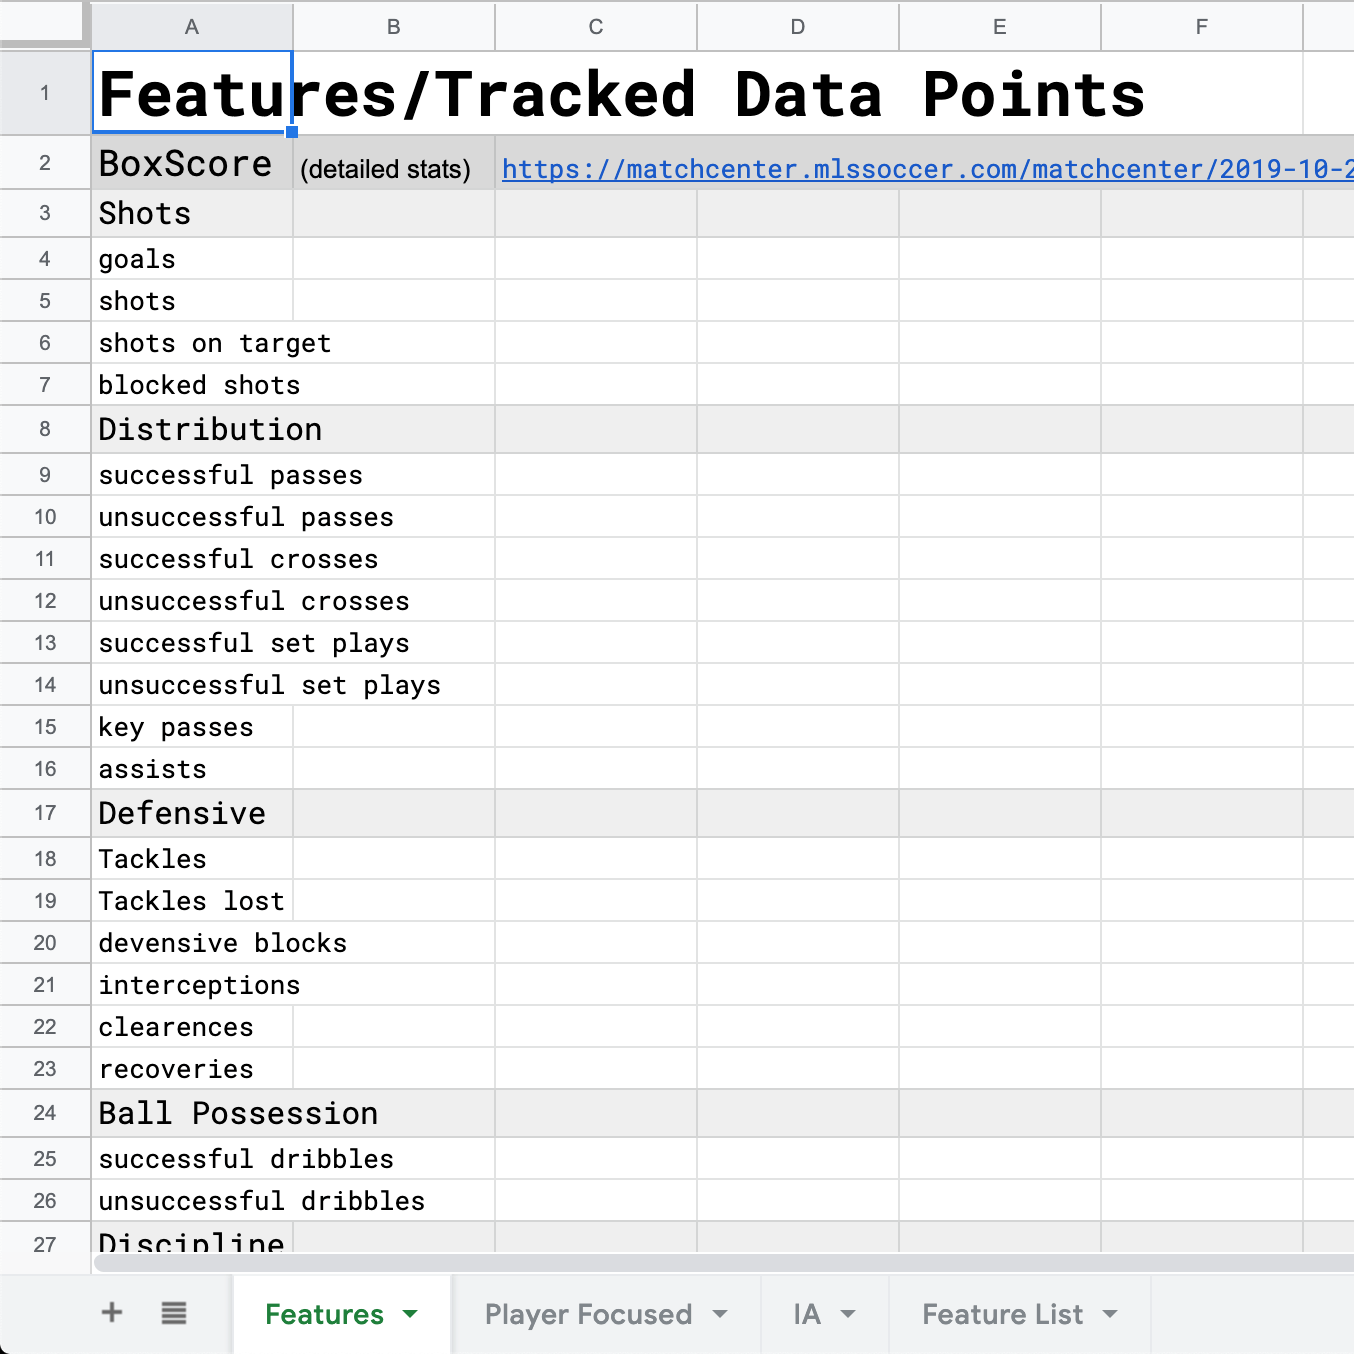
Exhaustively listing all stats that are tracked
Visualization Clarity and Usefulness Survey
Respondents were shown mockups of visualisations and asked to rate how interesting and how legible the visualization was. It also asked about when respondents used their phones during games. And finally, it asked respondents to choose the most valuable "soft" information about individual players.
Focus on Players' Physical Feats and Importance to the Team
The survey also asked respondents to choose what information they found most interesting about any given player.

Passing and Shot Completion Rate
The most common responses were things like pass accuracy and shot accurace, i.e. how effective the player is during the run of play.

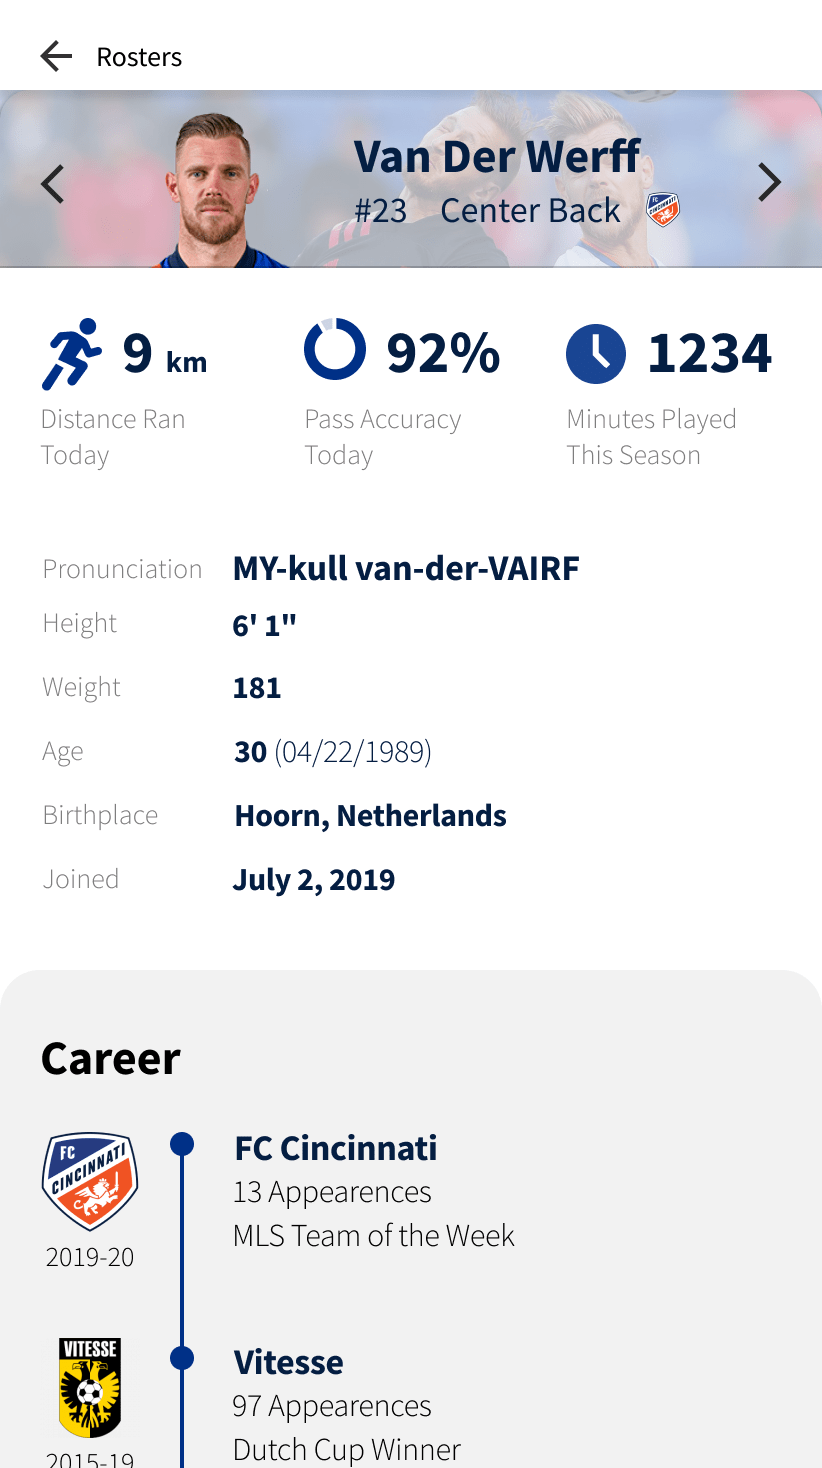
Roster Information and Player History
Next, respondents were interested in biographical information about the players like poistion, jersey number, the players' personal background, how long the player was with the team, etc.

Distance Ran
Respondents were also interested in things like distance ran and top speed, i.e. the athletic feats that players accomplish
Fans use Phones during Stoppage
Most fans primarily use their phones when play is stopped, not during the run of play. This presents an opportunity to surface key information especially during important stoppages, like Penalty Kicks. Respondents note that they like to record big moments when they can.
Player Centered Callouts are Universally Best
The survey found that focusing on calling out and highlighting players was both the most clear and most interesting information. Although respondents found Shot Charts and Passing Charts interesting, they were largely illegible. And heatmaps were legible, but least interesting on their own.
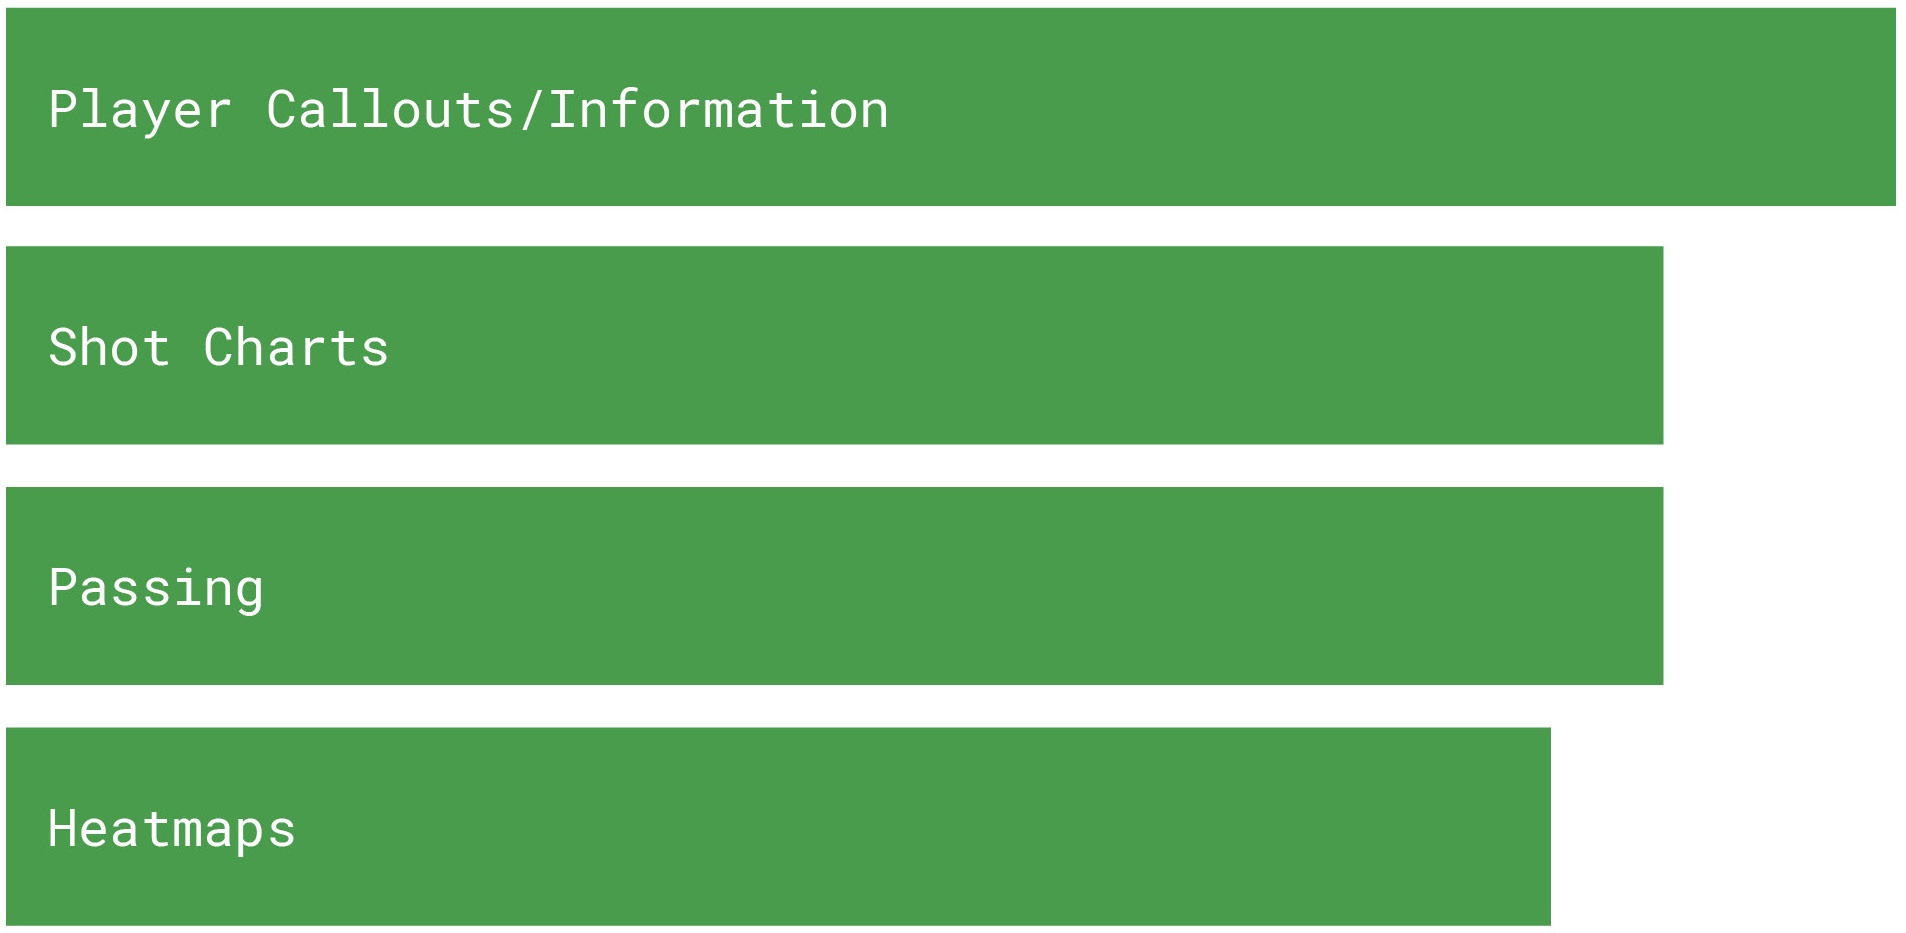
Actual proportions of responses per the survey
"[player callouts] are much easier for identifying players I don't know too much about"
- Push notifications when the app can offer relevant statistics
- Serve curated statistics relevant to the situation
- Record and save unobstructed video to keep the memory
Click me!
Go fullscreen here ↓
Check out more of my work: